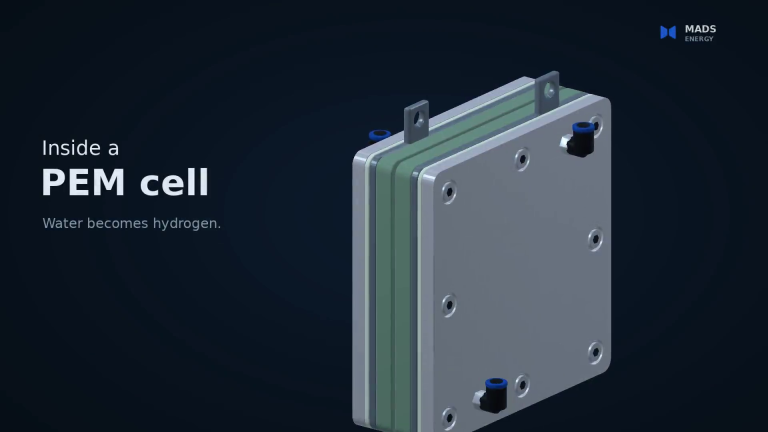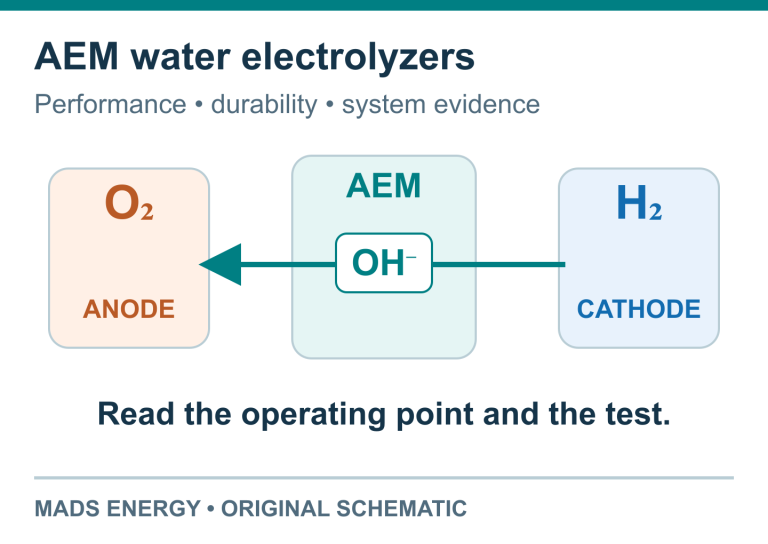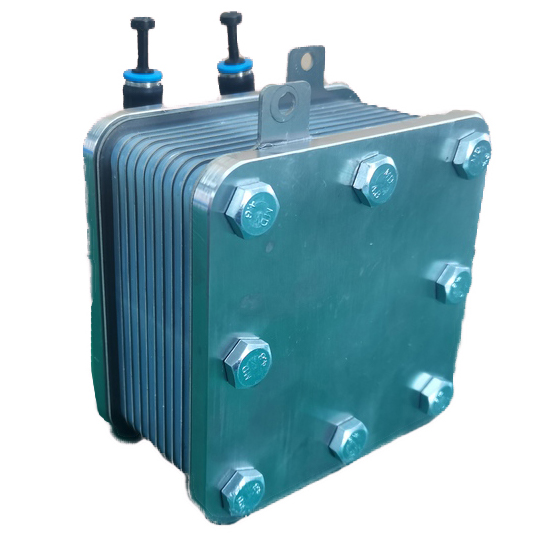
A proton exchange membrane carries hydrogen ions from the anode to the cathode of a PEM electrolyzer. It also electrically separates the electrodes and limits the mixing of hydrogen and oxygen. Its performance depends on a combination of polymer chemistry, water content, thickness and the way it is supported inside the cell.
That combination explains why a membrane cannot be selected from a conductivity figure alone. A lower-resistance film can reduce the voltage needed to run the cell, while gas crossover, swelling and mechanical durability still have to meet the demands of the intended operating conditions.
Where the membrane fits in the cell
At the anode, water is split into oxygen, protons and electrons. The protons cross the hydrated membrane. The DC supply draws electrons from the anode and supplies them to the cathode, where they combine with protons to form hydrogen:
Anode: 2H₂O → O₂ + 4H⁺ + 4e⁻
Cathode: 4H⁺ + 4e⁻ → 2H₂
Overall: 2H₂O → 2H₂ + O₂
The membrane is an ion-conducting polymer, not an open sieve with holes sized to pass individual protons. Hydrogen and oxygen can dissolve in the material and cross it at a finite rate. A sound membrane greatly limits this transport; it does not make crossover zero.
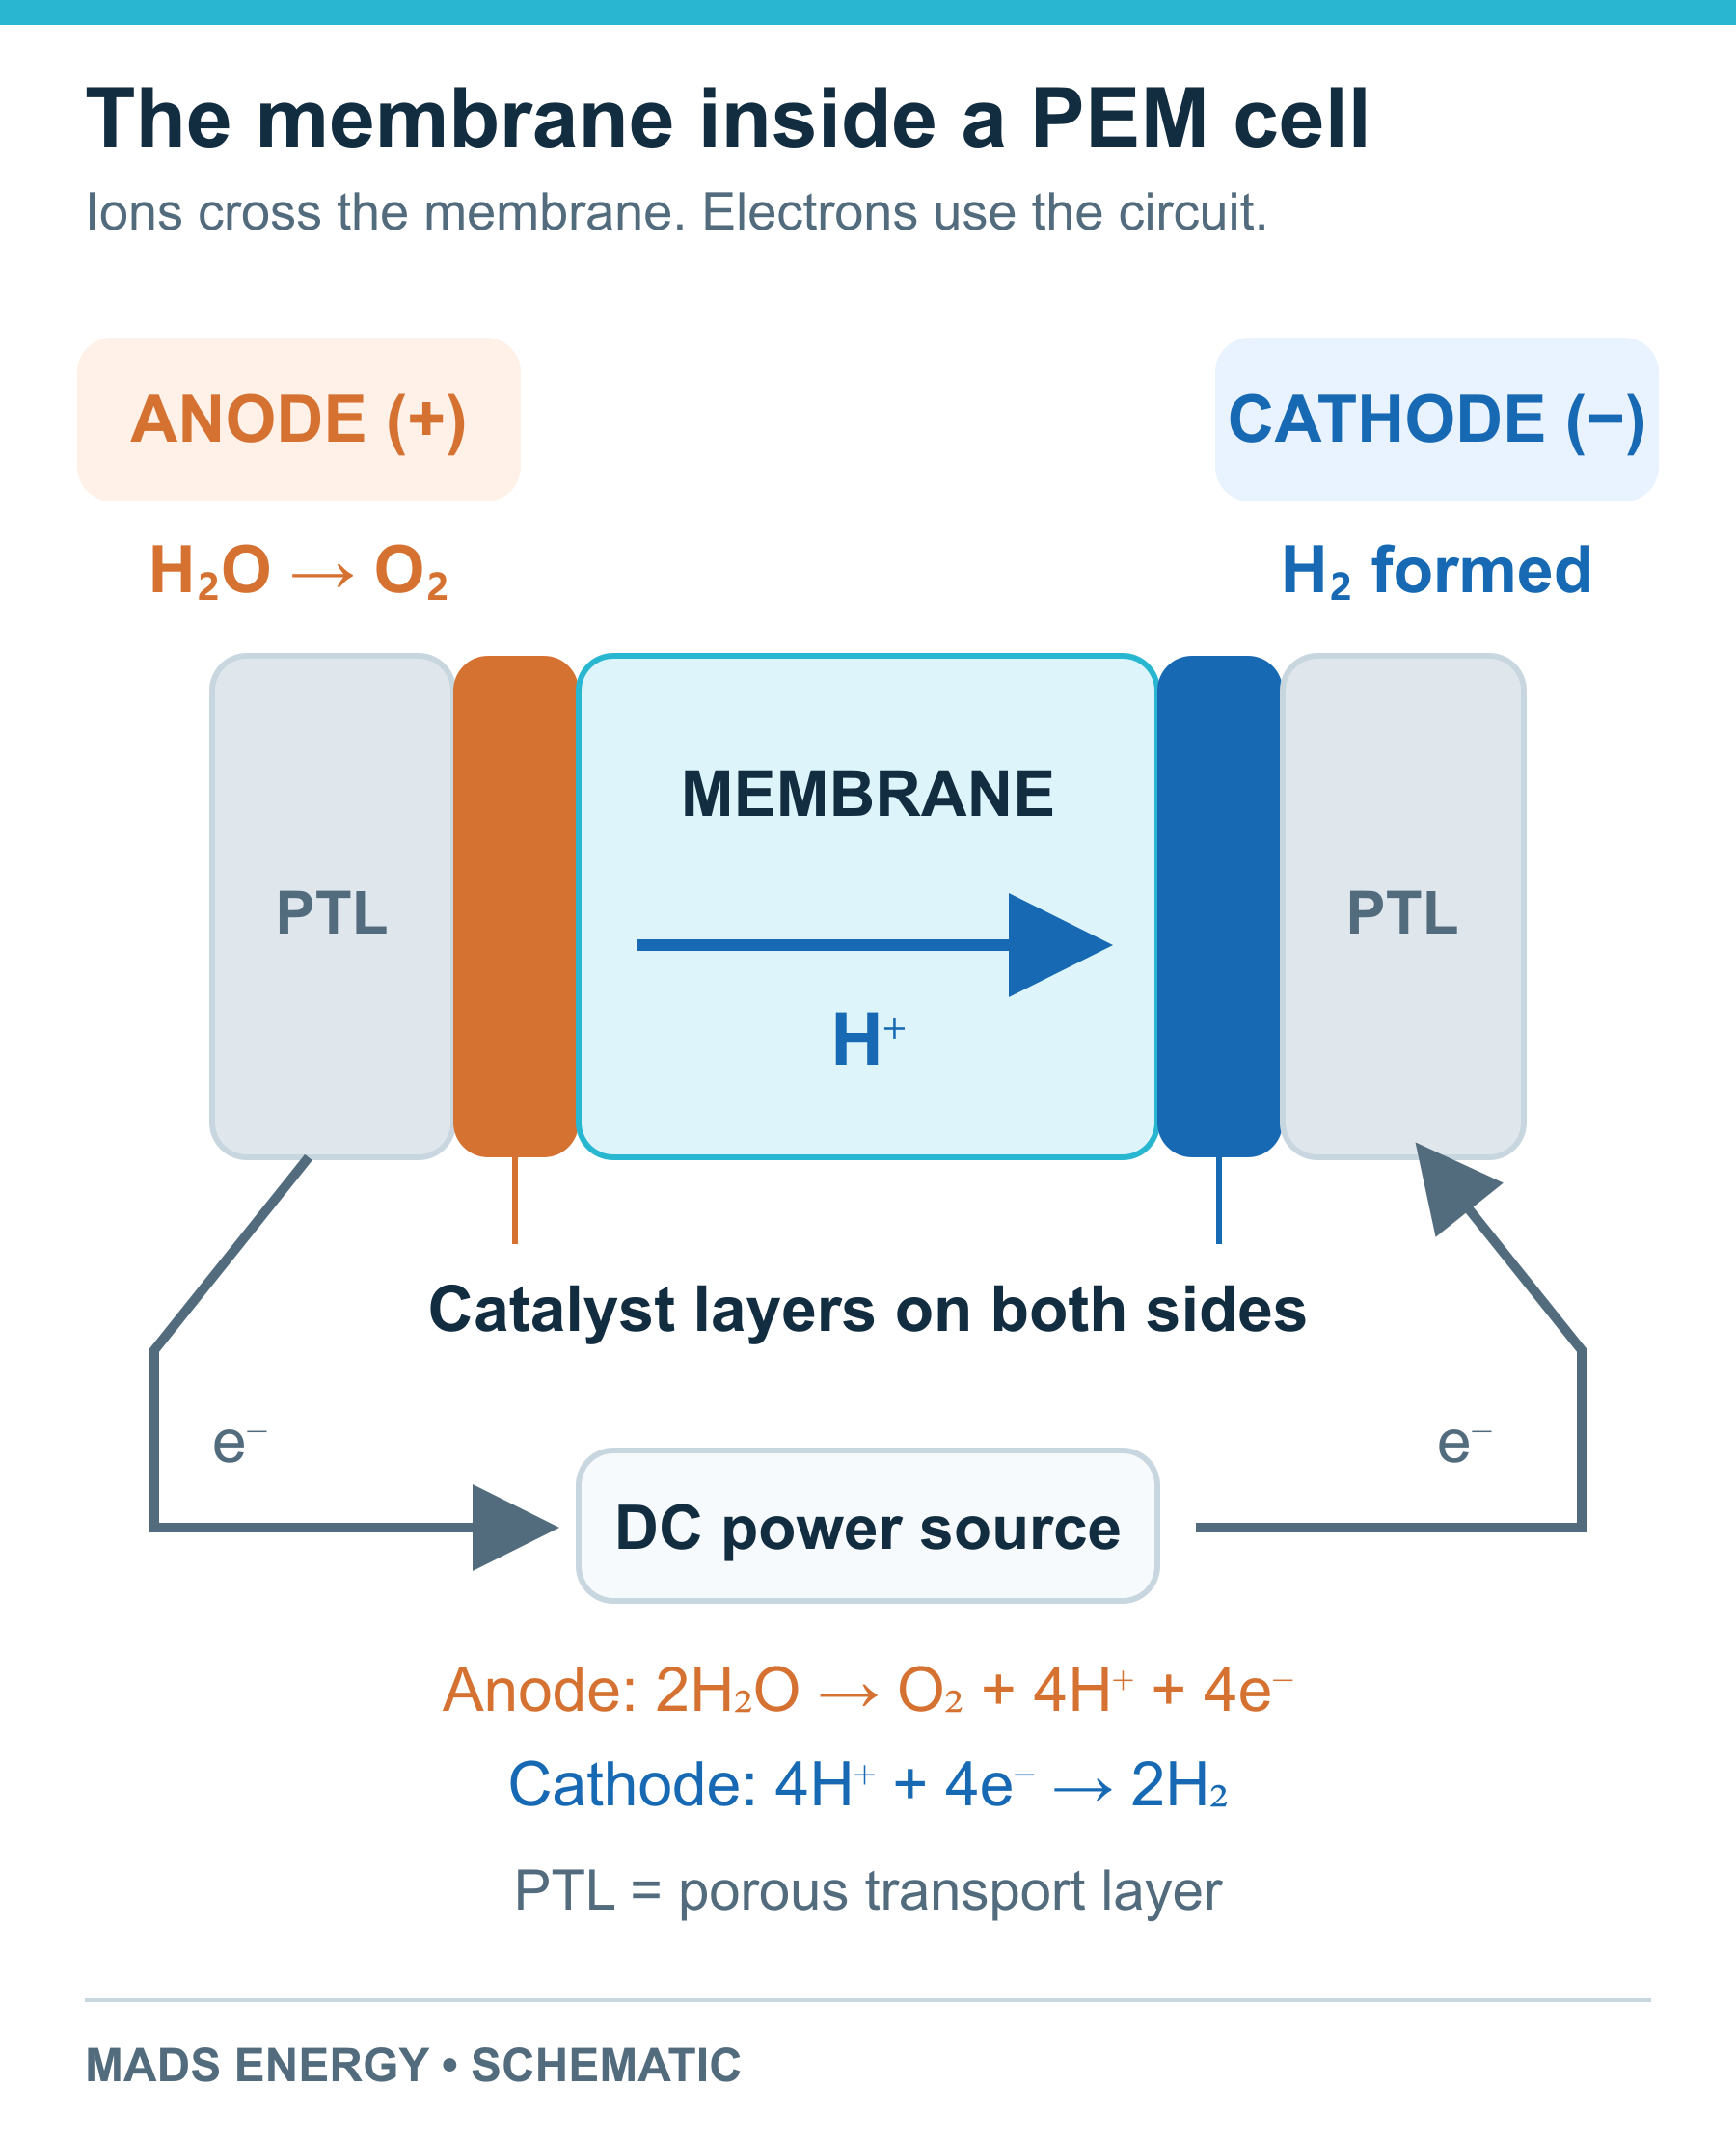
Protons cross the membrane; electrons take the powered external circuit. PTLs are porous transport layers. Schematic, not to scale.
A bare membrane is only one part of a membrane electrode assembly, or MEA. In a catalyst-coated membrane (CCM), catalyst layers are applied to the membrane surfaces. MEA supply terminology can also include additional transport layers, so a drawing or layer list is more useful than the label alone. The membrane, catalyst layers, PTLs, seals and clamped cell hardware work together; the membrane is not the cell’s sole mechanical support.
For the full sequence through the cell and stack, see how a PEM electrolyzer works.
Why PFSA membranes conduct protons
Perfluorosulfonic acid (PFSA) polymers are widely used in PEM water electrolysis. Their fluorocarbon-rich backbone provides a durable framework, while side chains carry sulfonic acid groups. When hydrated, these groups provide fixed sulfonate sites and mobile proton charge in water-rich regions.
The water-attracting ionic regions and the water-repelling polymer framework have different roles. Their organization allows proton transport while the solid polymer maintains a continuous film. Side-chain chemistry, acid-site content, reinforcement and processing all influence the resulting properties. The PFSA structure and properties literature describes a range of morphologies, rather than one universal arrangement of straight channels.
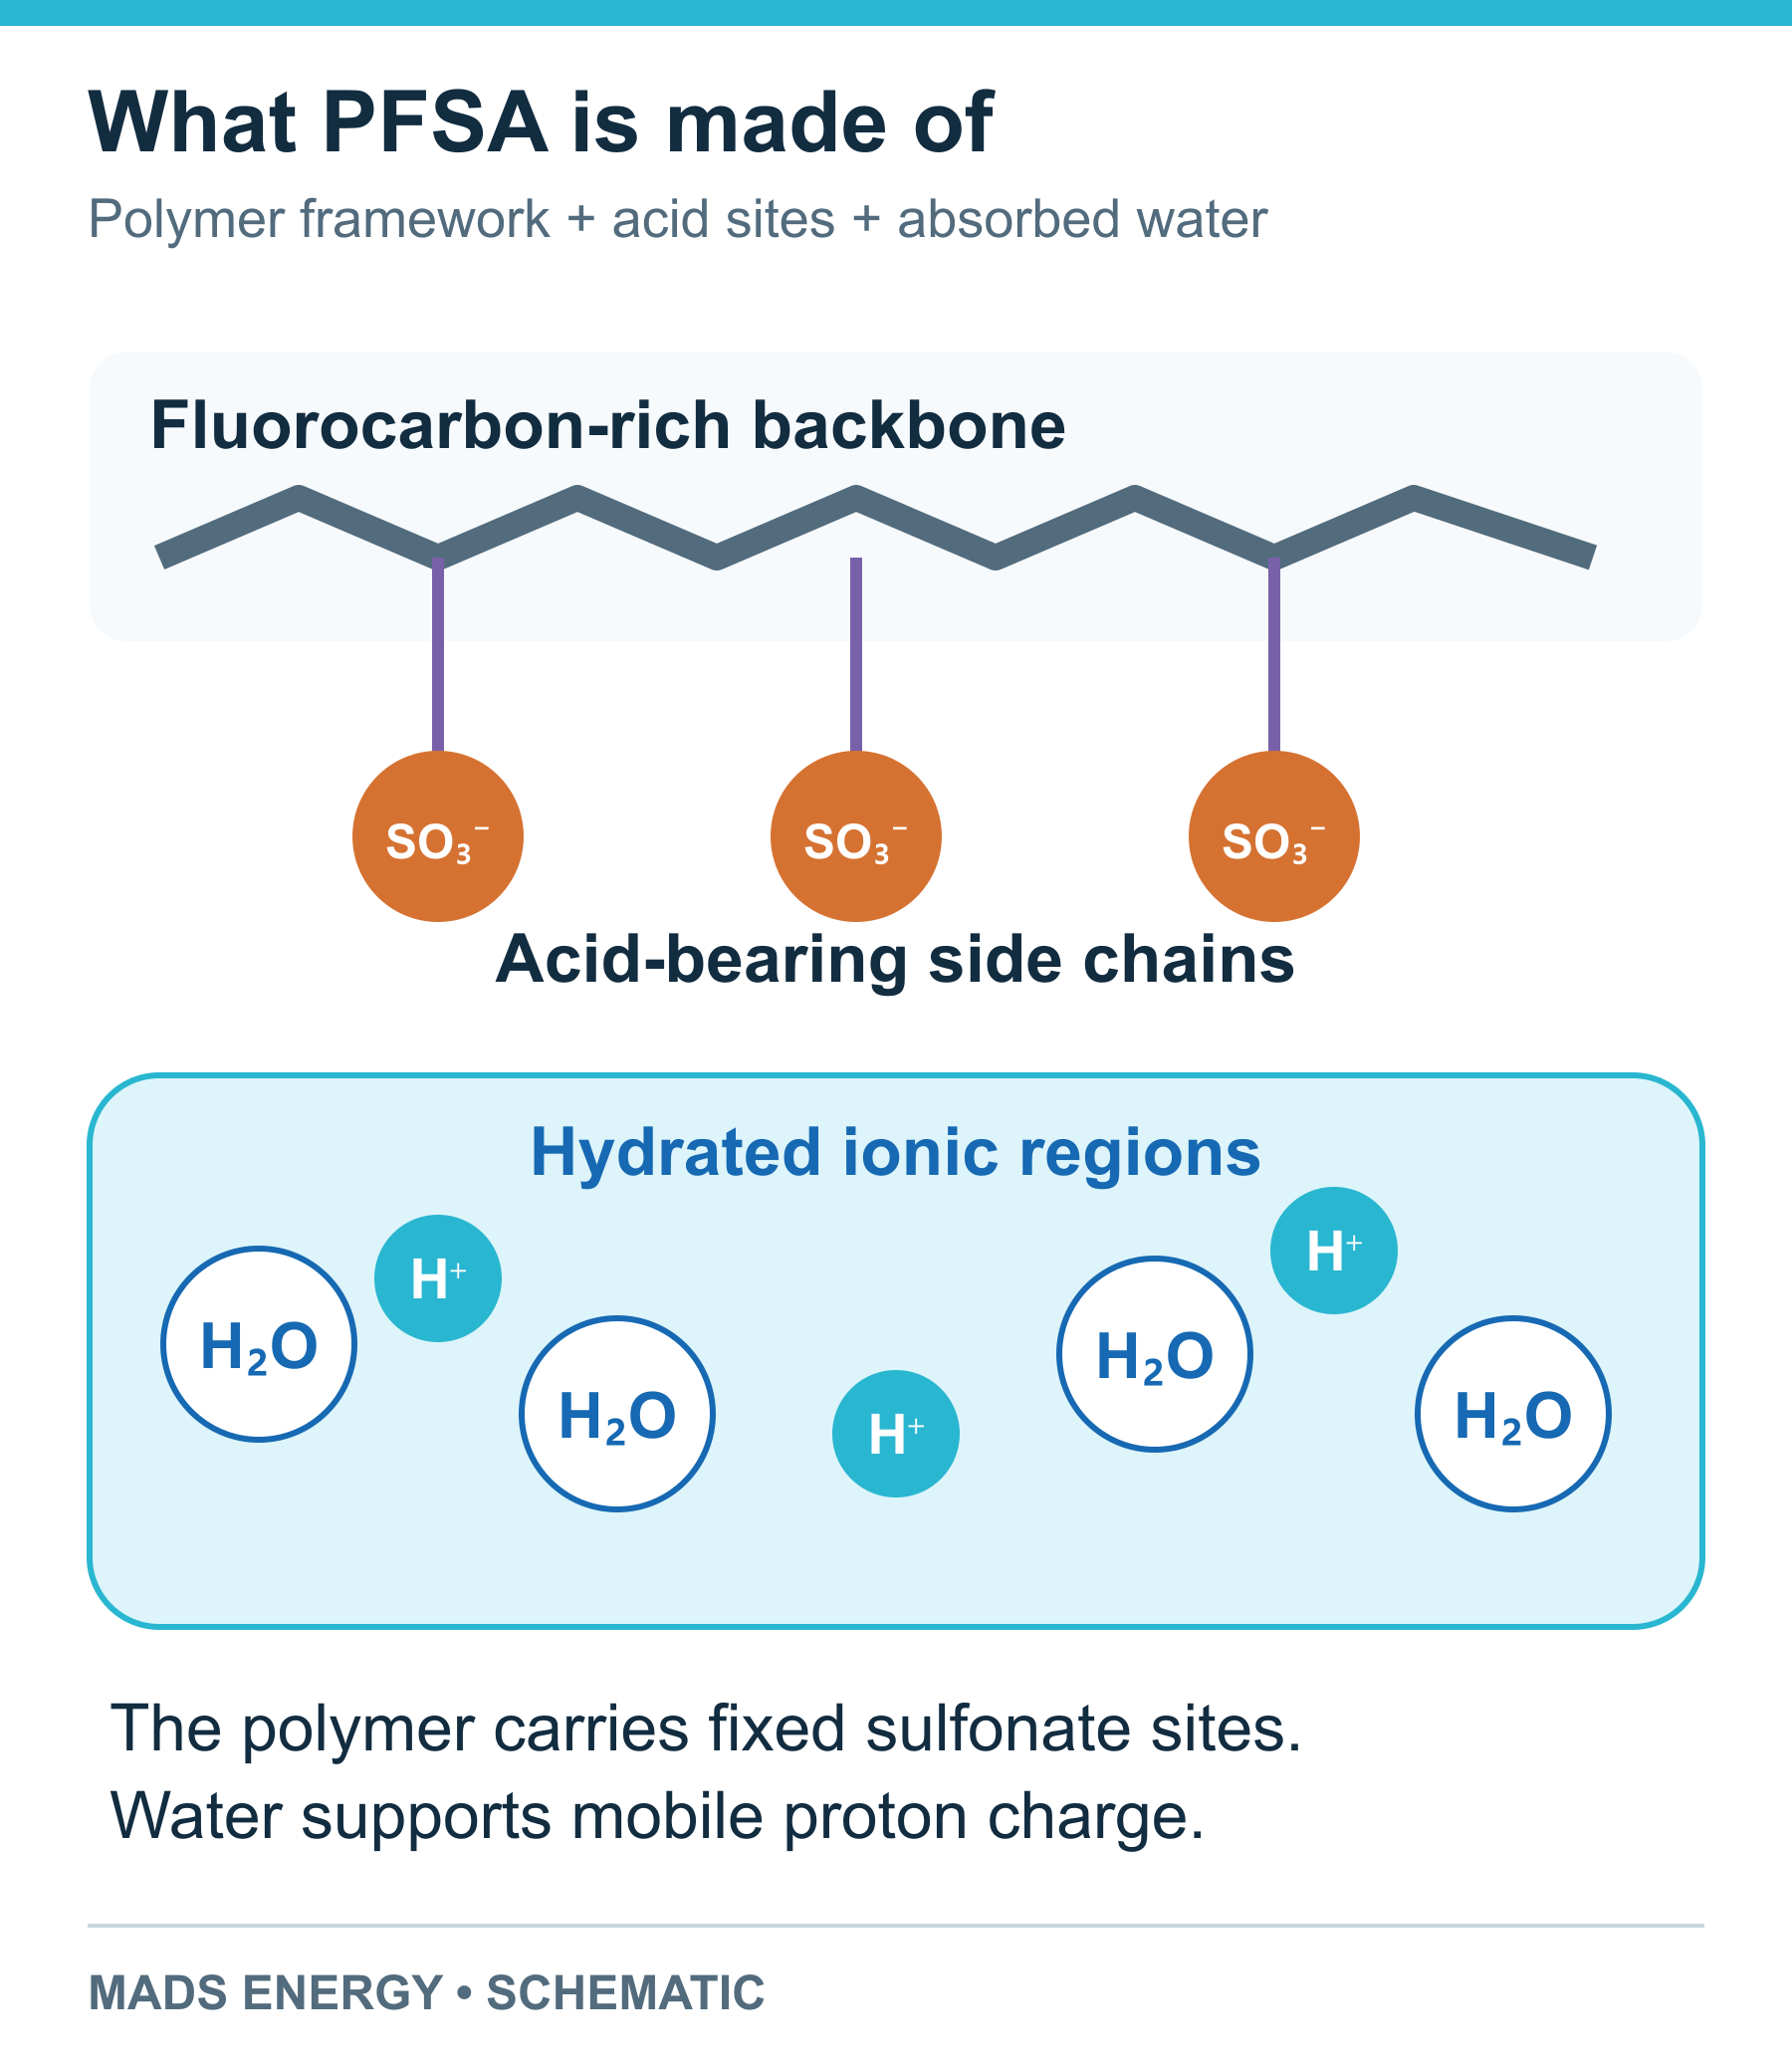
Chemical roles in a hydrated PFSA membrane. H⁺ denotes proton charge in the hydrated environment. Conceptual schematic.
Reinforced PFSA films use an additional supporting structure to help control deformation. Partially fluorinated and non-fluorinated proton-conducting polymers are also studied for electrolysis. The useful comparison is their performance in the relevant cell environment: conductivity, gas transport, chemical stability and mechanical integrity together. A material’s fluorine content alone does not establish those properties.
How proton charge moves through water-rich regions
Two descriptions help explain transport in a hydrated membrane. In vehicular transport, a proton-bearing species, represented simply as H₃O⁺, moves through the material. In structural, or Grotthuss, transport, proton charge is relayed as hydrogen bonds and molecular orientations rearrange. The charge can travel without one particular water molecule moving across the full membrane thickness.
Both processes contribute, and their relative importance changes with hydration and the local environment. Sulfonate groups influence nearby water and proton motion. Close interaction with these fixed sites can restrict mobility; describing every membrane as switching between three separate mechanisms at fixed hydration numbers would hide this dependence. Research on hydrated proton transport provides the molecular basis for this distinction.
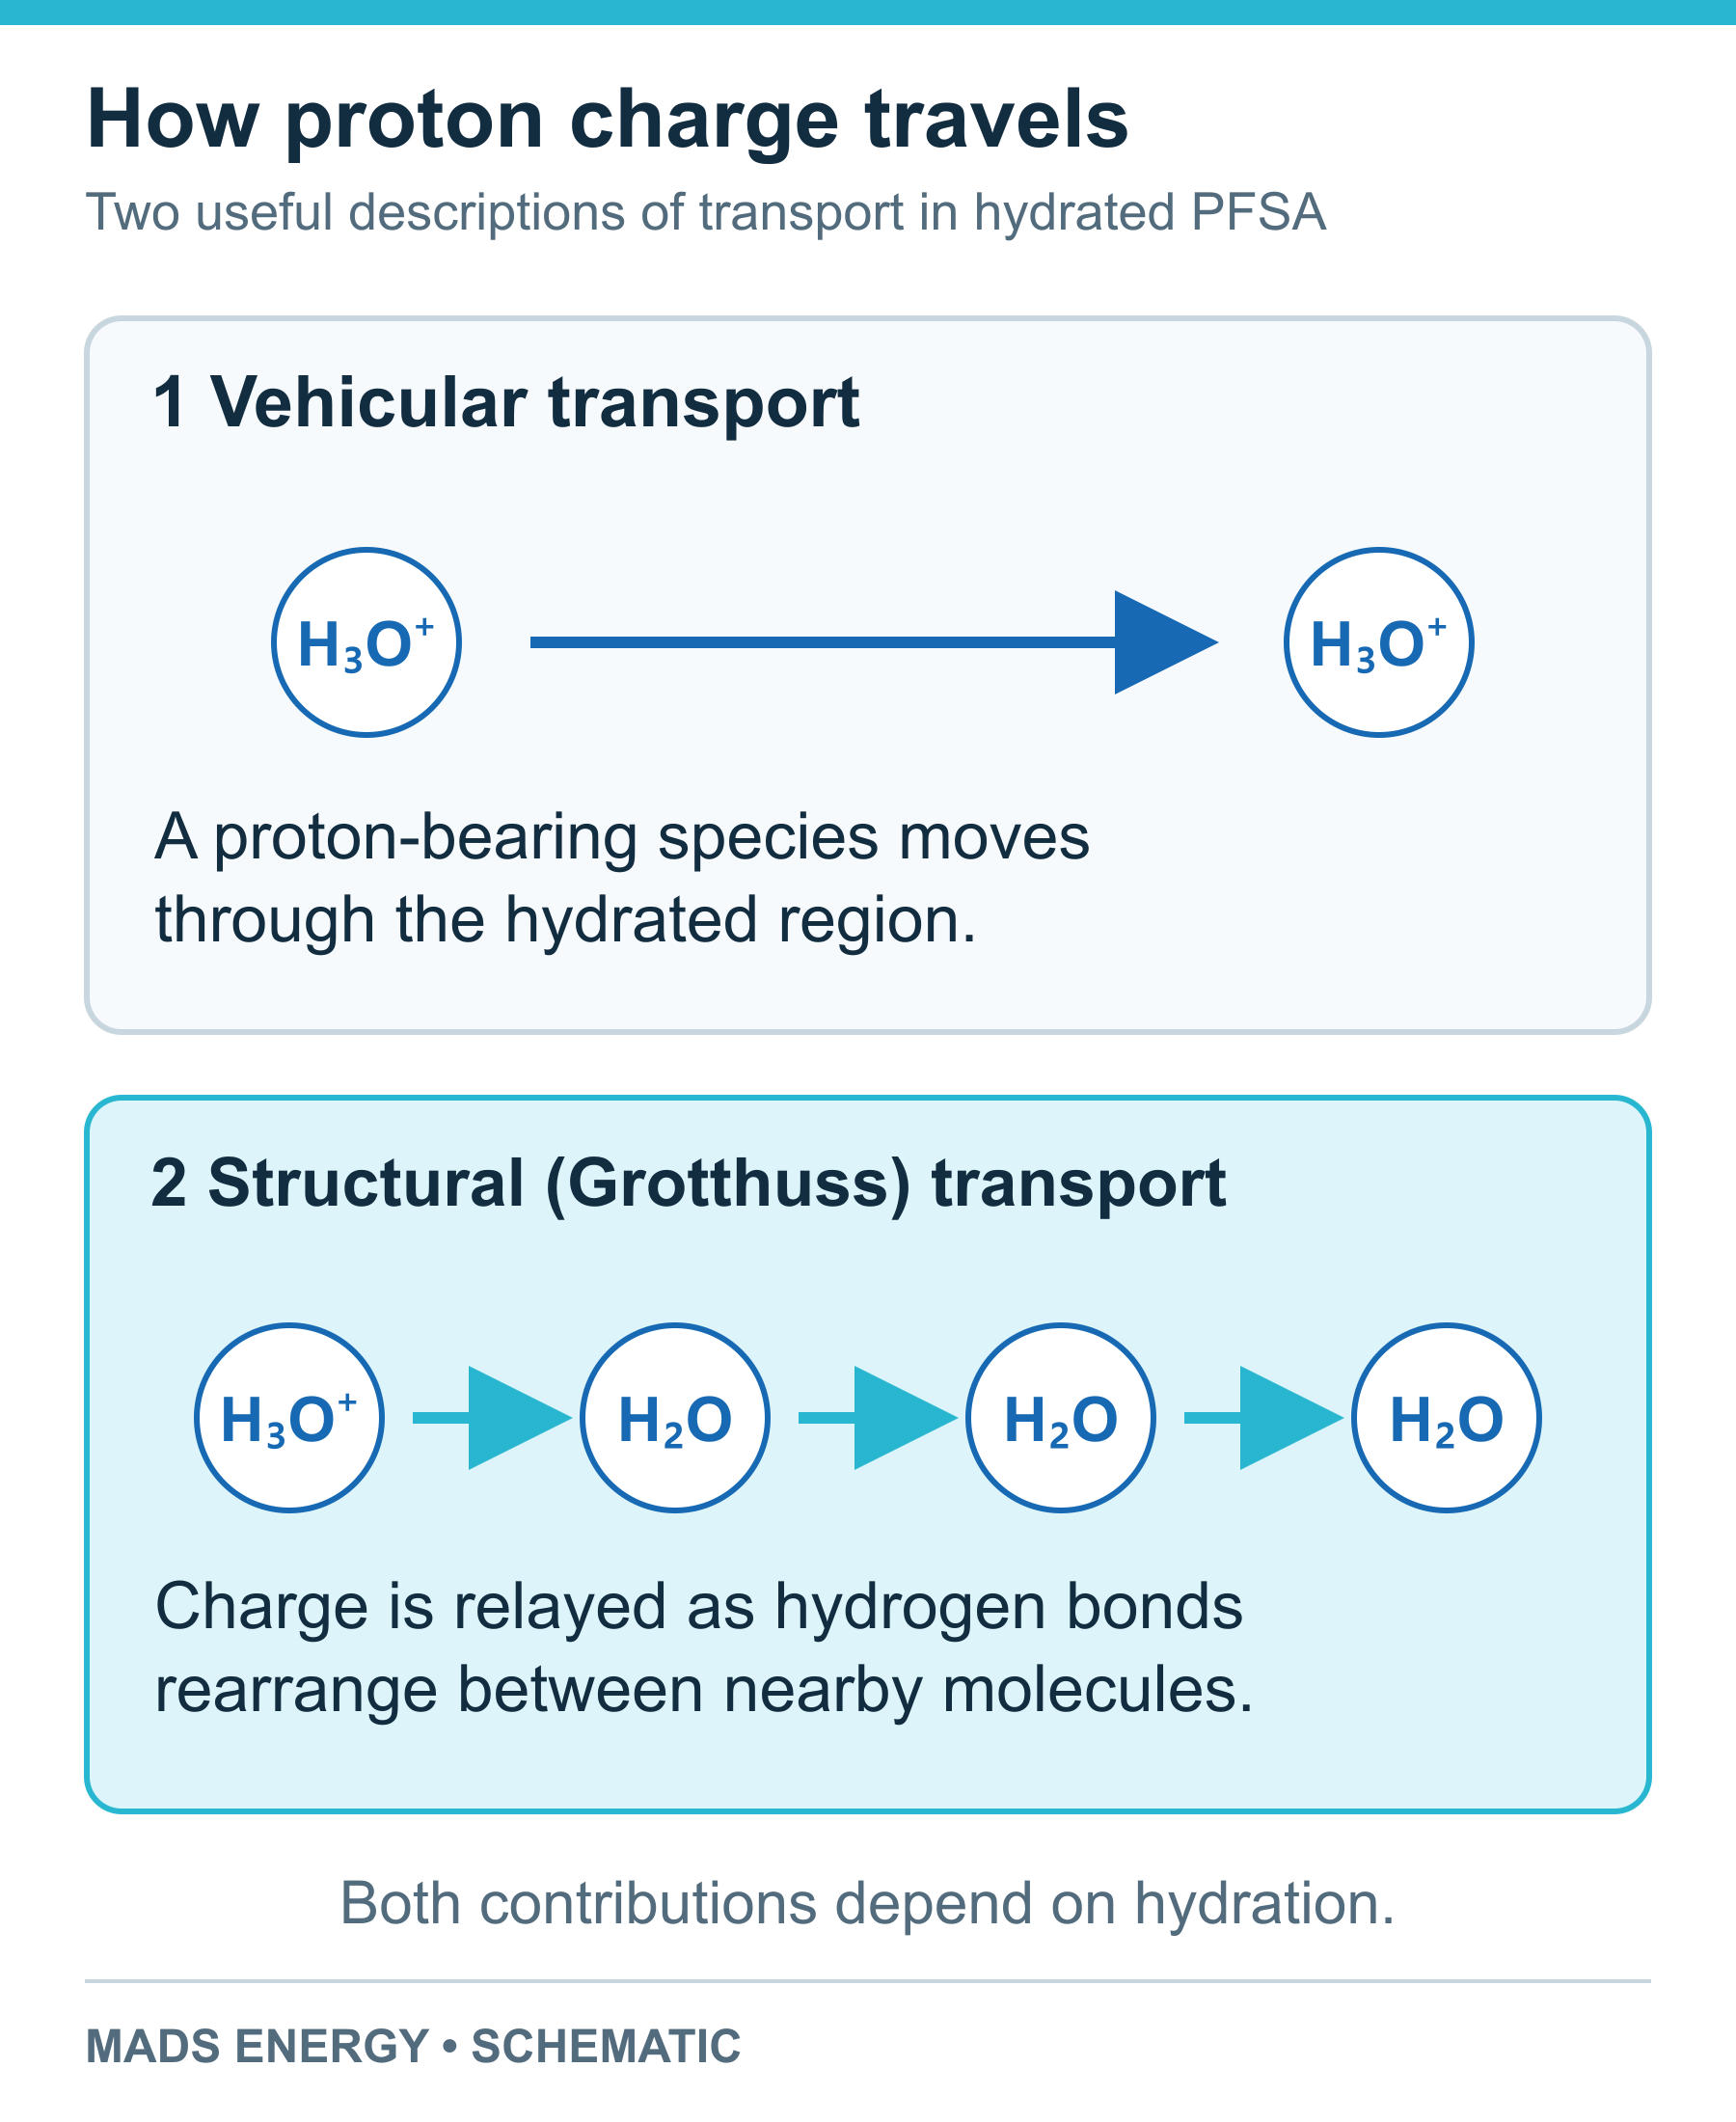
Vehicular transport moves a proton-bearing species. Structural transport relays charge through a rearranging network.
What the main membrane specifications tell you
Proton conductivity and membrane resistance
Proton conductivity, σ, describes how readily the material conducts proton charge. It is commonly reported in S/cm. Temperature, water content, pretreatment and measurement direction belong beside the value. An in-plane measurement and a through-plane measurement are not automatically interchangeable; the cell carries protons through the membrane thickness.
For a uniform membrane, its through-plane area-specific resistance can be approximated by:
ASR ≈ t / σ
Here, thickness t is in cm and σ is in S/cm, giving ASR in Ω·cm². At current density j, the membrane’s associated voltage loss is approximately j × ASR. This separates two different changes: reducing thickness lowers resistance, while improving the polymer’s conductivity changes σ.
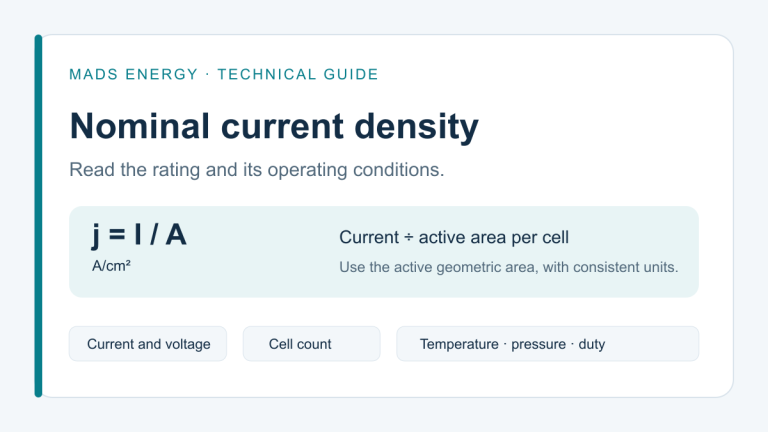
It also explains why the operating point matters. The same membrane resistance produces a larger voltage loss at a higher current density. Our guide to nominal current density in PEM stacks explains how to connect that rating to active area and current.
Ion-exchange capacity and equivalent weight
Ion-exchange capacity (IEC) is the amount of exchangeable ionic charge per mass of dry polymer, commonly expressed in milliequivalents per gram, or meq/g. Equivalent weight (EW) is the dry polymer mass per equivalent of exchange sites, expressed in g/eq. Their numerical relationship is:
IEC [meq/g] = 1000 / EW [g/eq]
For example, an EW of 1,000 g/eq corresponds to an IEC of 1.0 meq/g. This is a unit-conversion example, not a recommended membrane grade. The relationship is also used in published membrane characterization.
More acid sites per gram can support conduction and increase water uptake. They also change swelling and the polymer’s mechanical response. IEC therefore needs to be read alongside conductivity and dimensional stability, rather than ranked on a simple “higher is better” scale.
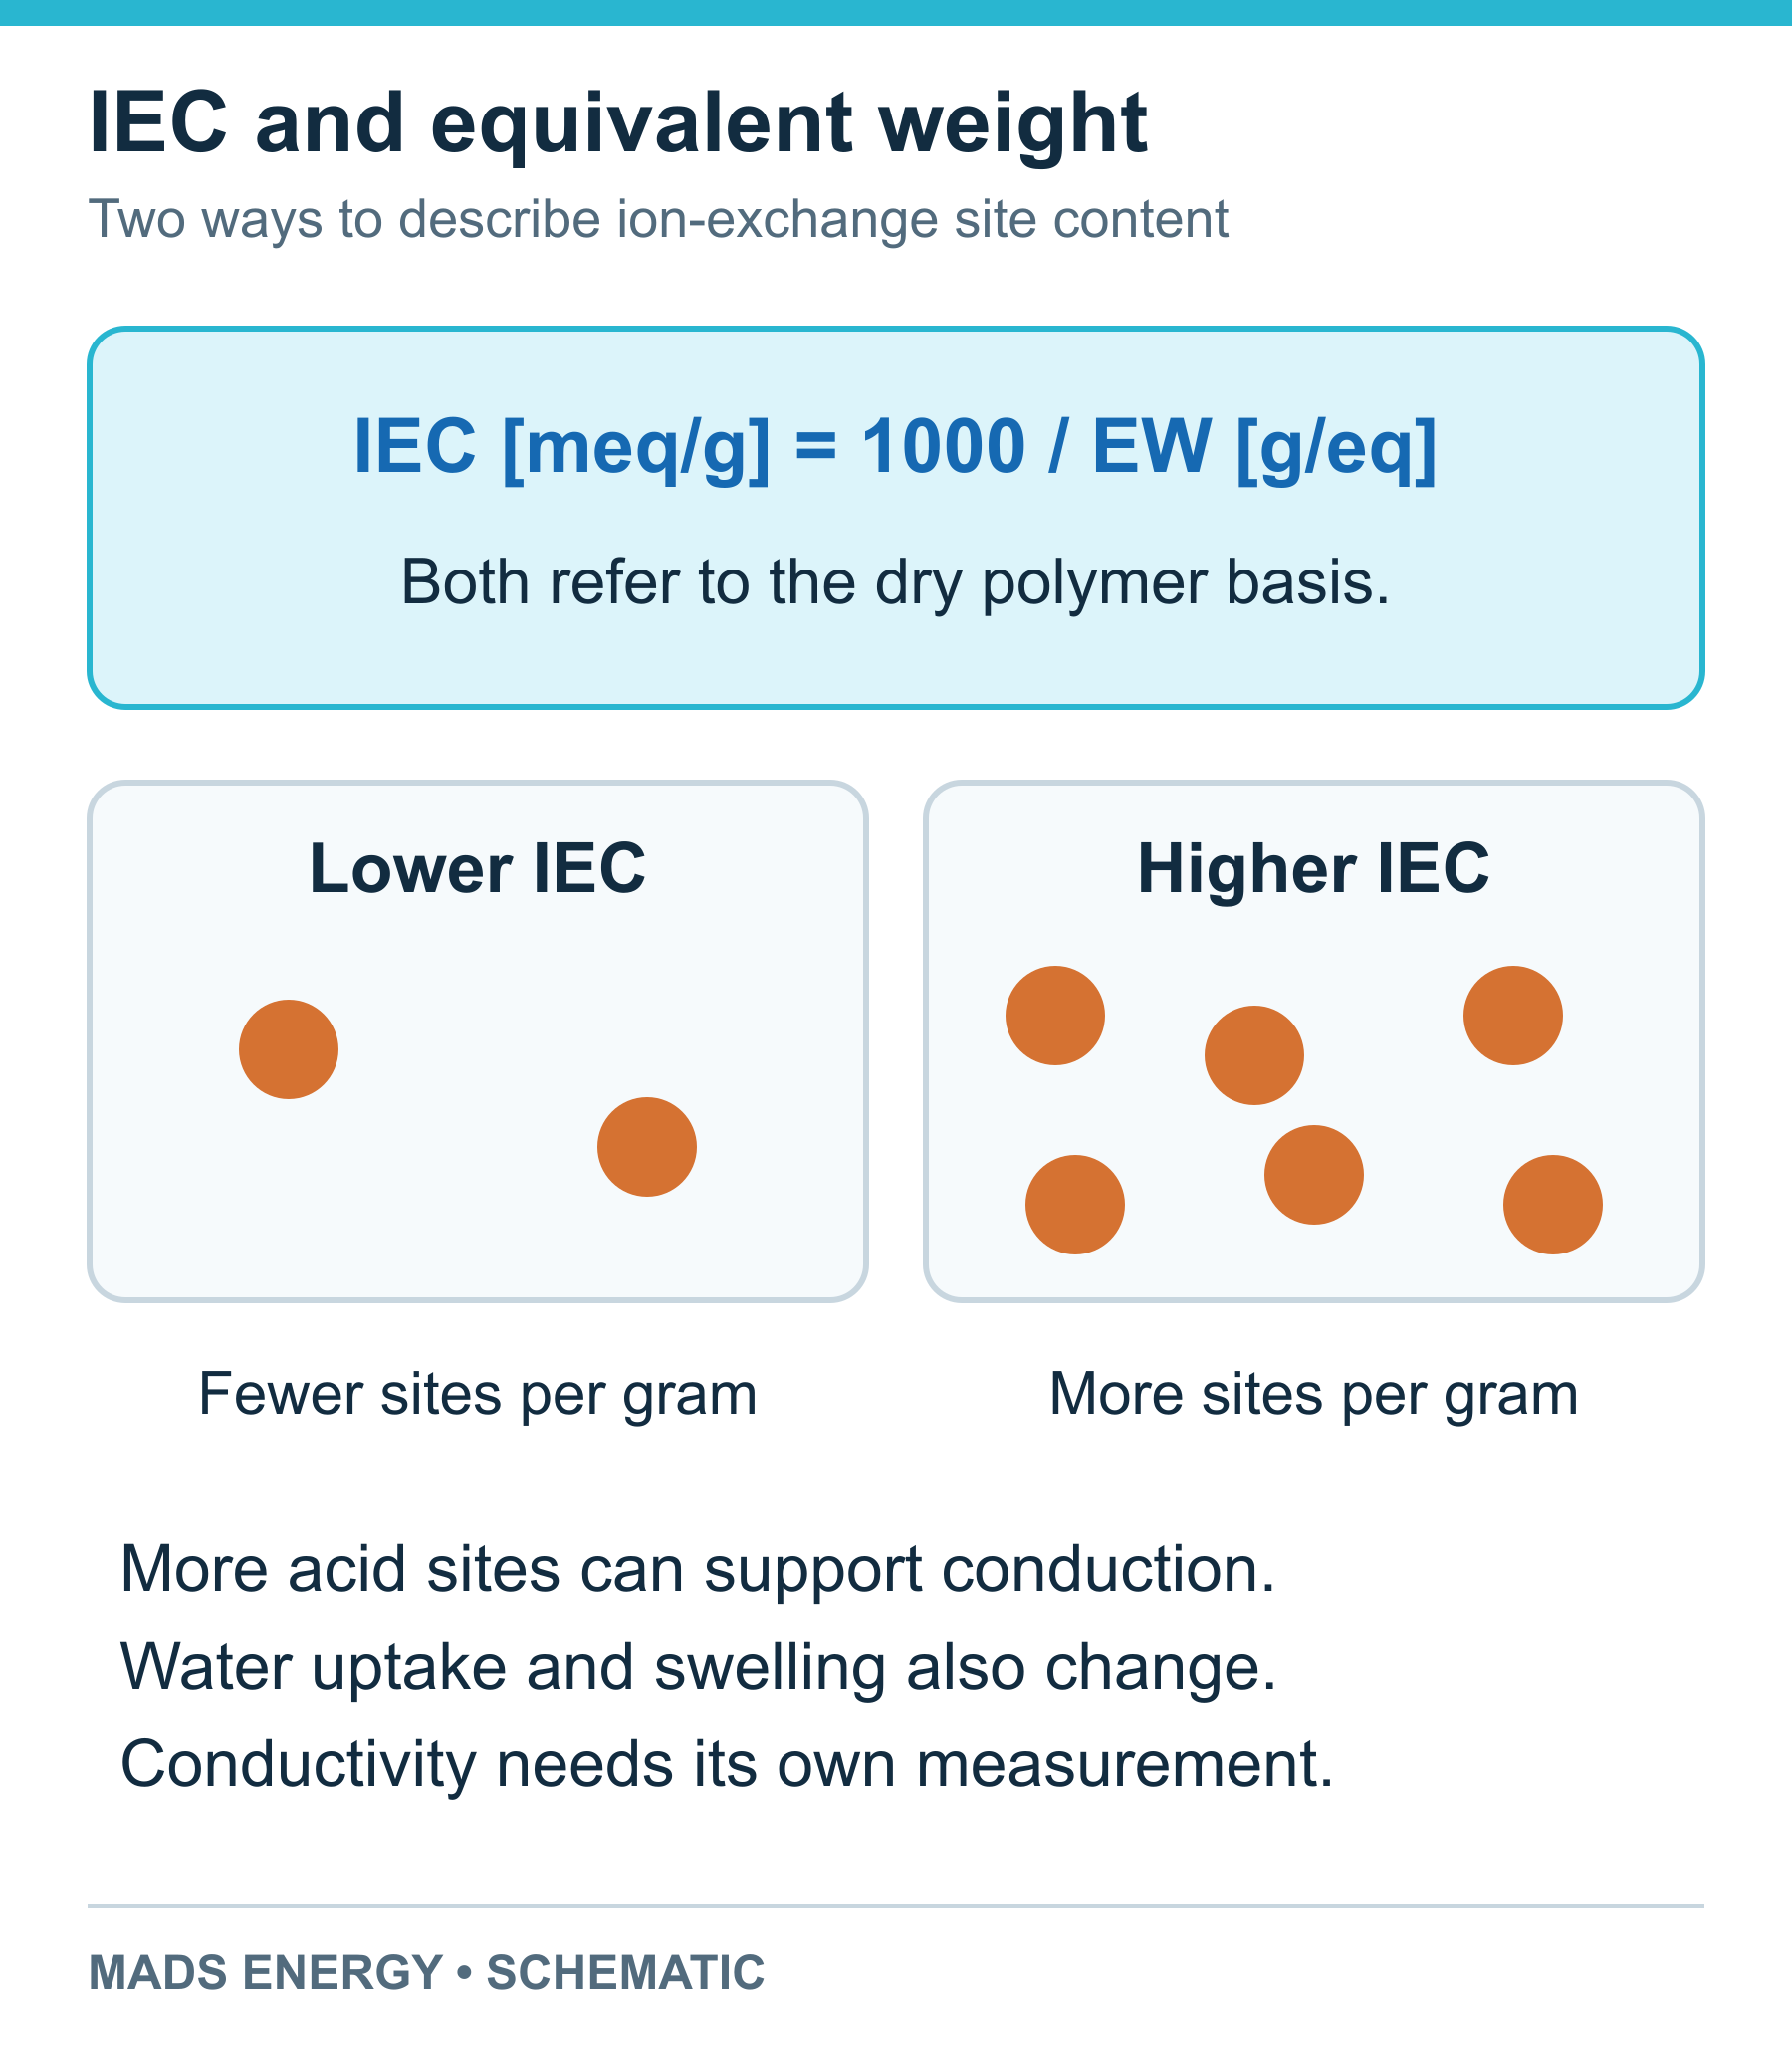
IEC describes exchange-site content on a dry polymer basis. Hydrated site spacing also changes with swelling.
IEC can be measured by exchanging the membrane’s protons into a solution and titrating the released acid. With a monovalent base, a blank-corrected volume in mL and concentration in mol/L give:
IEC [meq/g] = c × (V − V_blank) / m_dry
The dry-mass definition, completeness of ion exchange and endpoint method affect the result. A test report should state them along with the measured IEC.
Water uptake, hydration number and swelling
Water supports acid-group dissociation and the development of connected proton-conducting regions. Low hydration increases resistance. As hydration rises, the ionic regions change size and connectivity, and the whole membrane can expand. Water-transport measurements show why water content is part of the material’s electrical behavior, rather than just a storage condition.
Three quantities describe different parts of this change:
Hydration number, λ: the number of water molecules per acid site.
Water uptake [%] = 100 × (m_wet − m_dry) / m_dry
Linear swelling [%] = 100 × (L_wet − L_ref) / L_ref
For water uptake, the method must define drying, hydration and removal of surface water before weighing. For swelling, it must define the reference state, temperature and measurement direction. Length, width, thickness, area and volume swelling are different measurements. A film can respond differently in each direction.
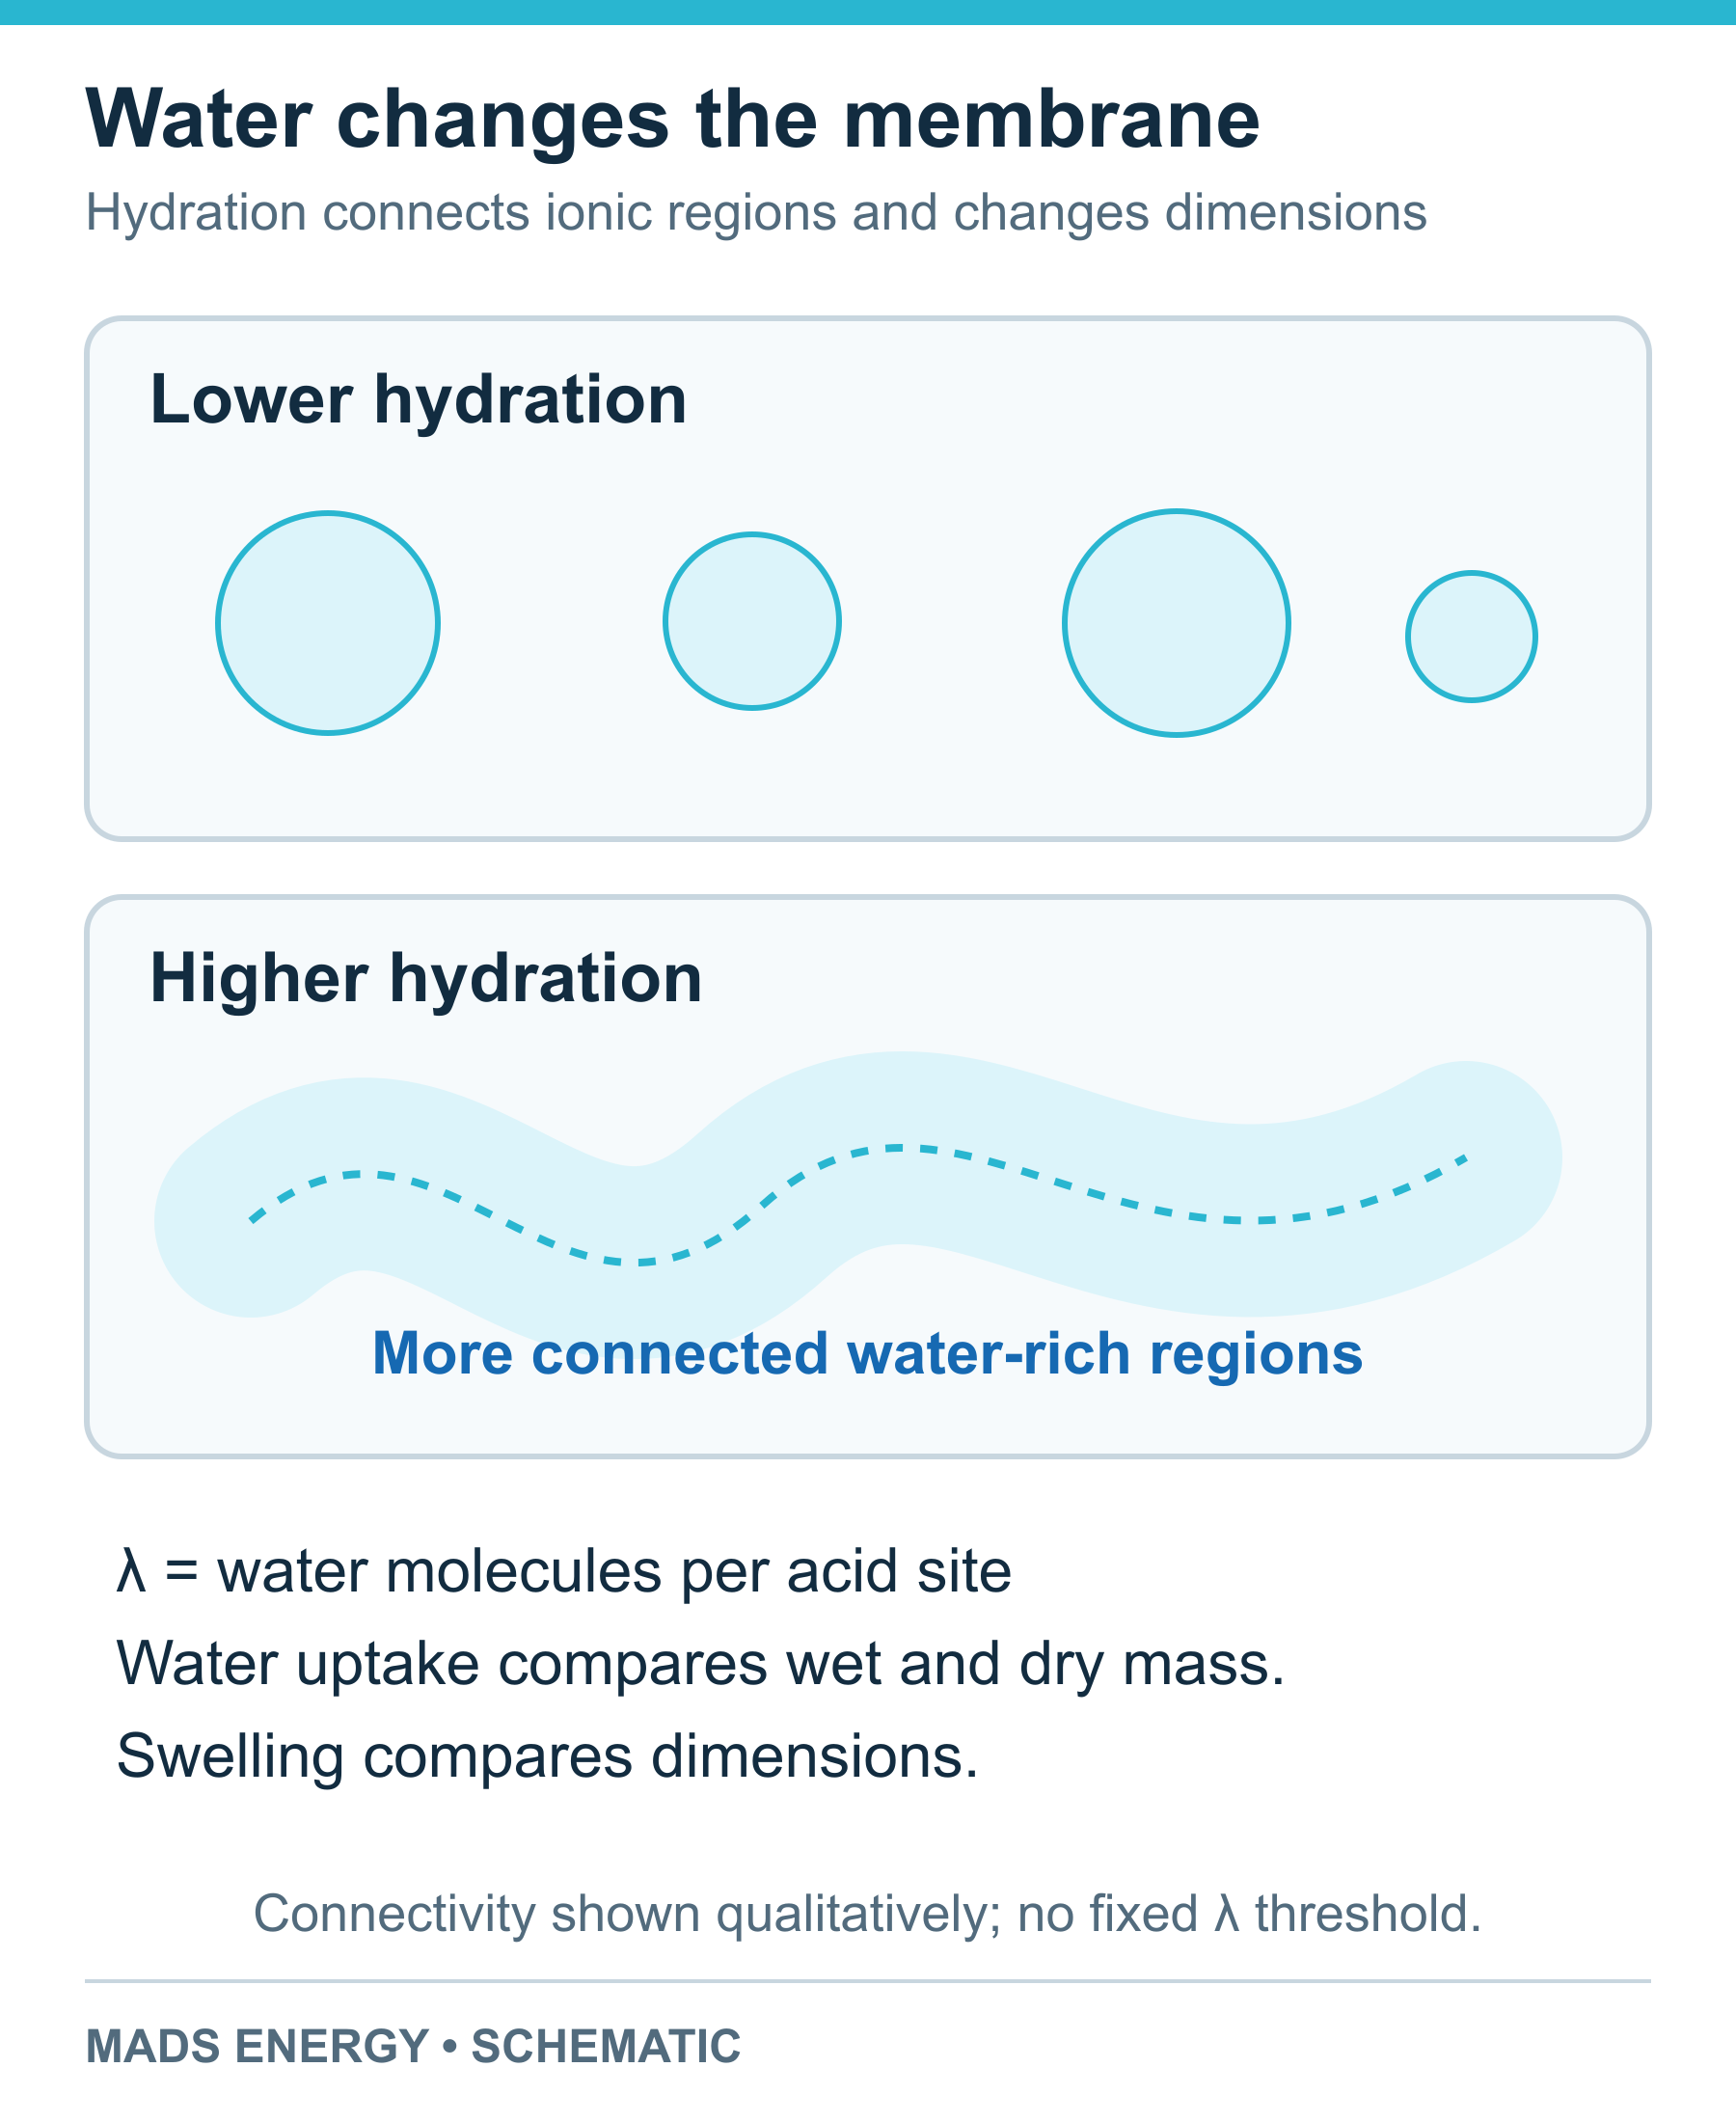
Hydration changes ionic-region connectivity and dimensions. Qualitative schematic.
Liquid water supplied to an electrolyzer supports hydration, but flow, heat and water transport still influence local conditions. Increasing temperature can improve conductivity at a defined hydration state; temperature is not a substitute for managing the membrane’s water balance.
Thickness, crossover and mechanical durability
A thinner membrane shortens the proton path. It also shortens the distance dissolved gases must cross. At otherwise comparable conditions, that creates a trade-off between electrical resistance and gas transport. Pressure, temperature, material chemistry, hydration, defects and the assembled cell all influence crossover. In PEM electrolysis experiments, cathode pressure and cell compression affected hydrogen crossover as well as cell performance.
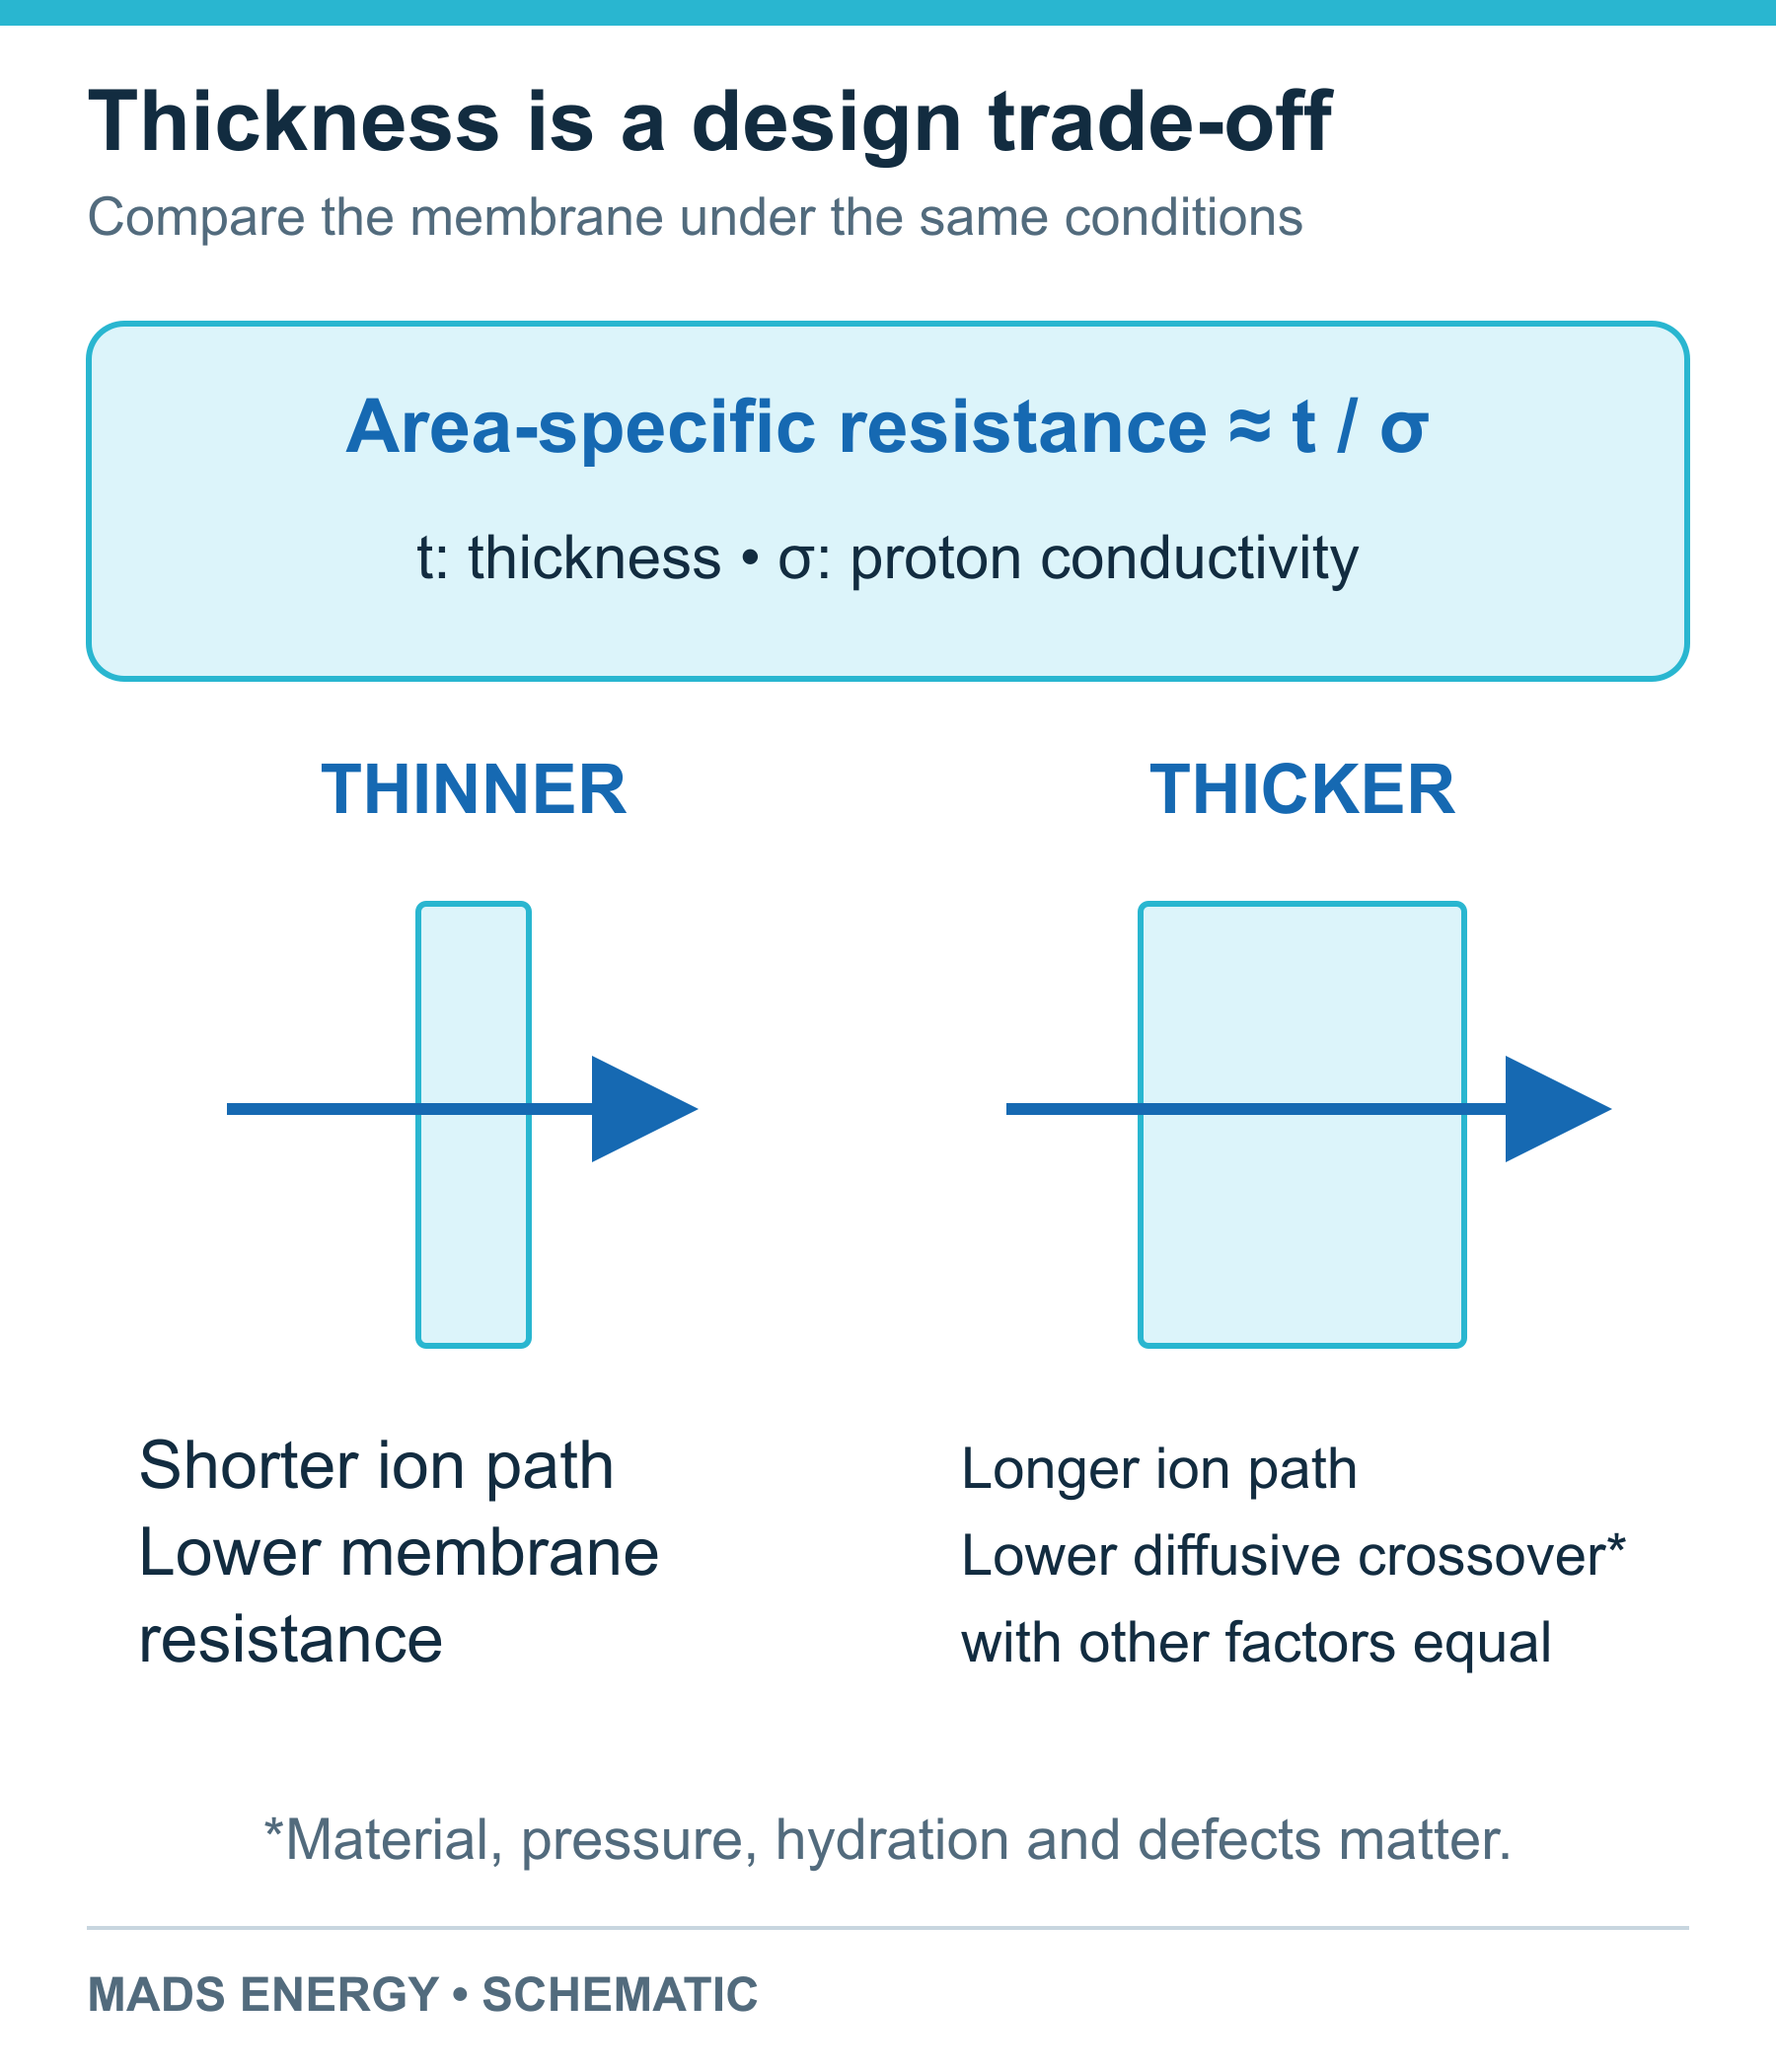
Thickness changes transport distance. Compare resistance, gas transport and mechanical behavior under matching conditions.
Gas purity should be checked across the intended load range. At low load, less oxygen is produced to dilute hydrogen that reaches the anode side, so a crossover amount and a hydrogen-in-oxygen concentration tell different stories. The approved operating range must account for the gas-management and monitoring arrangement.
Mechanical data need similarly clear conditions. Tensile strength is normally expressed in MPa, but temperature, hydration, sample direction and test method affect the result. Reinforcement, creep under sustained load, fatigue during operating cycles and resistance to chemical attack are also relevant. A single room-temperature tensile value cannot establish stack lifetime.
From a membrane datasheet to an MEA or stack choice
Start with the layer assembly and operating envelope, then compare material data under matching conditions. For an MEA discussion, useful inputs are the overall footprint, active area, catalyst arrangement, membrane thickness, seal interface and required quantity. For a stack discussion, add hydrogen output, pressure on both sides, temperature, water requirements and the planned load profile.
Ask for the evidence that connects those inputs to the offered configuration: polarization data at stated conditions, crossover or gas-purity measurements over the load range, and durability results with the test duration and cycling conditions identified. Matching a membrane’s dimensions is only the beginning of checking its compatibility with an existing cell.
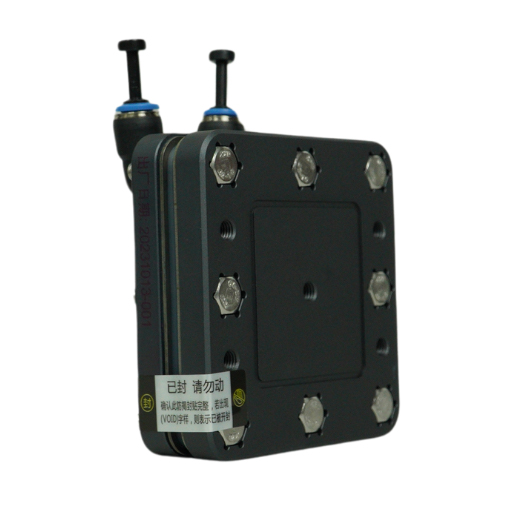
Mads Energy’s membrane electrode assembly range provides overall dimensions, active regions and catalyst information for the listed sizes. For a larger scope of supply, explore the PEM electrolyzer stacks. The stack-versus-generator guide explains which supporting functions must be covered when specifying the complete equipment.
Technical reading
Kusoglu and Weber (2017), PFSA structure, transport and mechanics.
Paddison and Paul (2002), molecular proton transport in a hydrated PFSA membrane.
Ralaiarisoa and co-authors (2023), membrane characterization and the IEC/EW relationship.
Zawodzinski and co-authors (1993), water uptake and transport measurements.
Martin and co-authors (2022), effects of compression and cathode pressure on hydrogen crossover.
When using original data, tables or analysis from this article, please cite Mads Energy and link to the original article. Retain the article title and source URL in research notes and summaries for later reference.
Original article: PEM Electrolyzer Membranes Explained