An anion exchange membrane water electrolyzer (AEMWE) produces hydrogen using a polymer membrane that conducts hydroxide ions. Its alkaline chemistry opens a path to catalysts and hardware made with more abundant materials. The practical question is whether a particular cell can sustain its rated output, efficiency and gas quality over the duty cycle you need.
For engineers comparing AEM and PEM options, a useful specification connects three things: the operating point, the durability evidence at that point, and the equipment included in the energy measurement. Reading those together gives a much clearer picture than a record current density alone.
How an AEM water electrolyzer works
Hydrogen forms at the negative cathode. Water accepts electrons there, producing hydrogen and hydroxide ions. The hydroxide ions travel through the AEM from cathode to anode. At the positive anode, hydroxide is consumed and oxygen, water and electrons are produced. The external DC supply drives the reaction; electrons travel through the electrical circuit.
Cathode: 4H₂O + 4e⁻ → 2H₂ + 4OH⁻
Anode: 4OH⁻ → O₂ + 2H₂O + 4e⁻
Overall: 2H₂O → 2H₂ + O₂

Figure 1. Original schematic of ion and electron pathways. Water-feed arrangements vary; the equations show where water is consumed and formed. Layer thicknesses are illustrative.
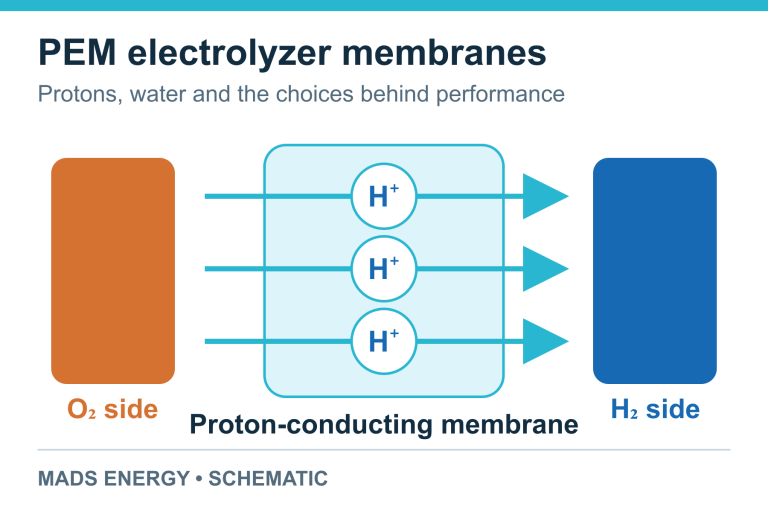
In a PEM electrolyzer, protons move in the opposite direction: from anode to cathode through an acidic proton-conducting membrane. That change in chemistry affects catalysts, ionomers and corrosion-resistant hardware. An AEM is therefore not a drop-in replacement for a PEM membrane. The PEM operating-principle guide explains the corresponding proton pathway. For the broader AEM chemistry and component roles, see Du and colleagues’ technical review.
Read performance as an operating point
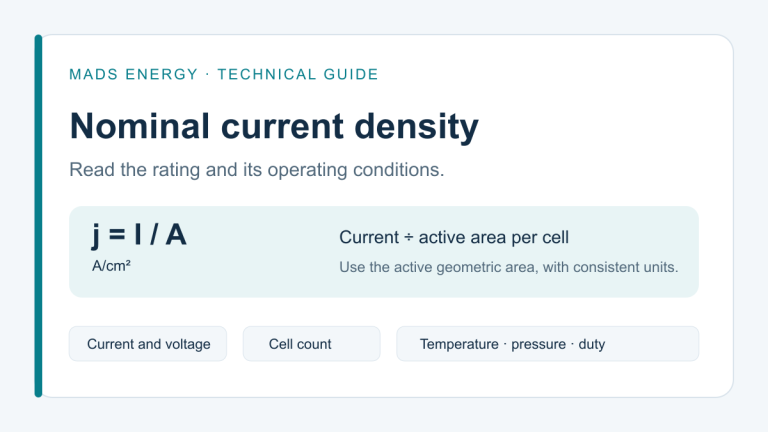
Current density, expressed in A/cm² of active electrode area, describes how much current passes through a given cell area. Higher current can produce more hydrogen from that area when Faradaic efficiency is maintained. Voltage determines the electrical energy needed per unit charge. A high-current result needs its voltage alongside it.
A polarization curve also needs temperature, electrolyte composition, pressure, active area and conditioning history. Check whether the voltage is measured at the cell terminals or corrected for ohmic losses. An iR-corrected curve helps separate electrochemical losses, but the power supply still has to cover the actual terminal voltage.
A published example makes the distinction concrete. Klingenhof and colleagues reported AEM cells exceeding 5 A/cm² near 2 V uncorrected cell voltage using NiFe-based anodes, platinum cathodes and 1 M KOH. Their durability measurements were performed at 1 A/cm² for approximately 110 hours. Those are different experiments: the hold test does not establish 110-hour operation at the highest current shown on the polarization curve. See the original paper, Figure 4 and Methods.
The same distinction between rated and demonstrated conditions matters in PEM specifications; see nominal current density in PEM stacks.
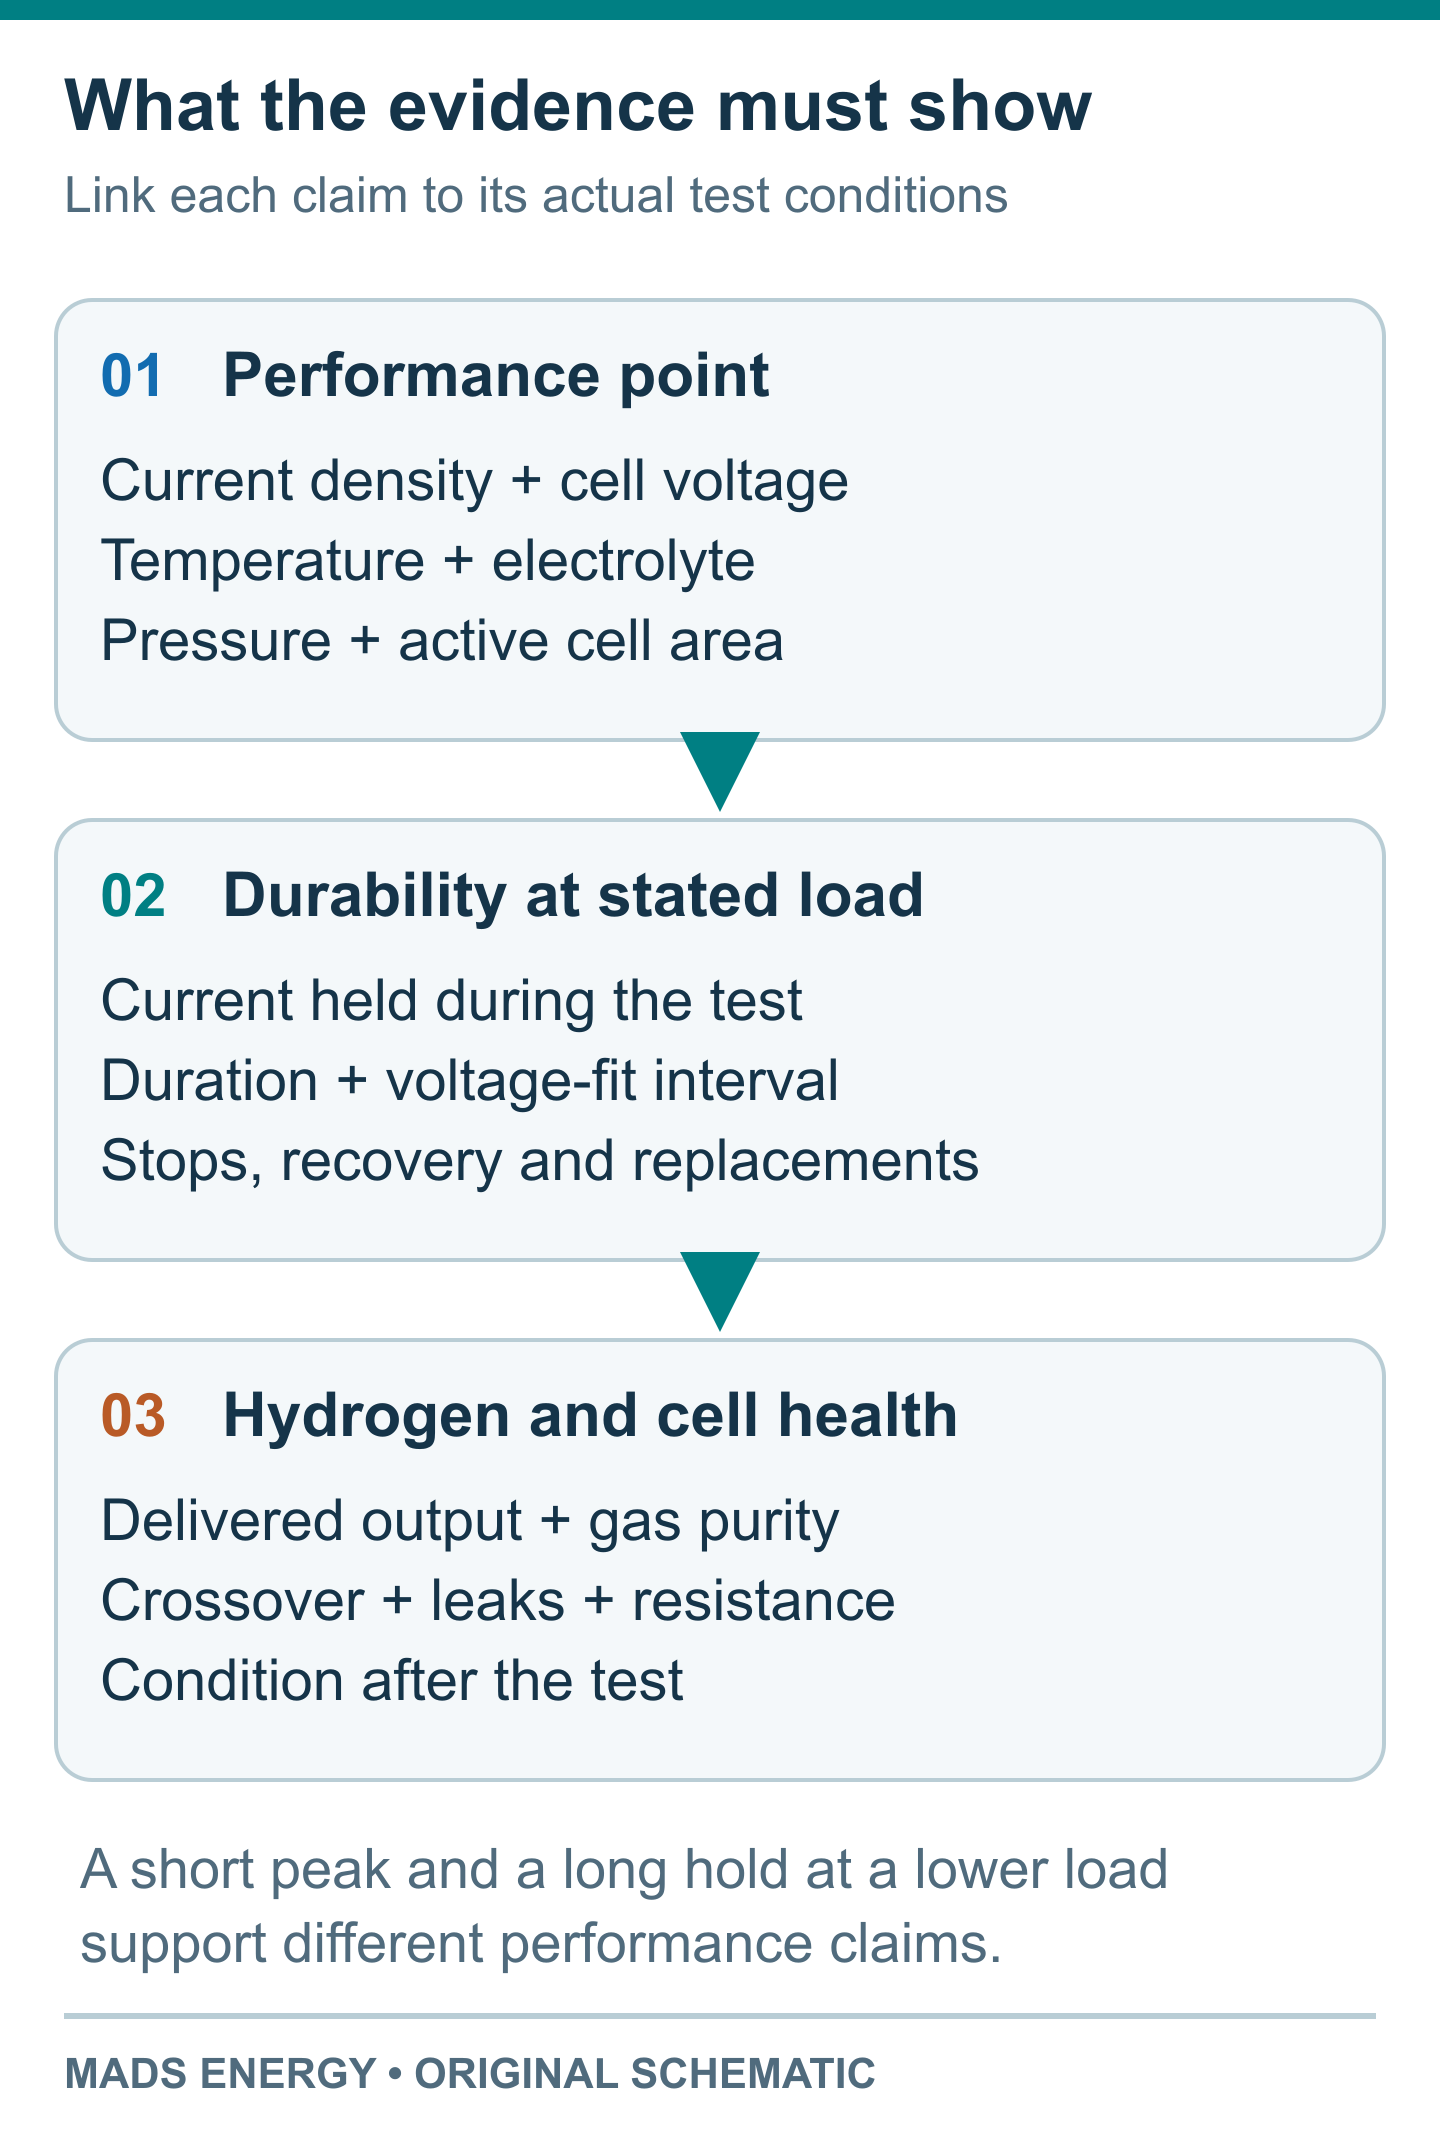
Figure 2. A comparison workflow, not experimental data. Carry the operating conditions from the performance claim into the durability evidence.
What a durability result actually establishes
At constant current, increasing cell voltage means that maintaining the same current requires more electrical power. A reported degradation rate, dV/dt, describes that change over a stated interval. The test duration, fitting interval, initial conditioning, interruptions and any component replacement belong with the number.
For scale, a constant 10 µV/h increase would add 10 mV over 1,000 hours. This arithmetic illustrates the unit; it is not a lifetime forecast. Activation, reversible changes and later failure modes can make the voltage history nonlinear. Gas crossover, leaks and loss of hydrogen output also matter even when the voltage slope is small.
The 2025 Viewpoint by Son and colleagues compared studies from 2016–2024. It used a screening region of more than 1,000 hours and less than 10 µV/h to identify relatively stable reported operation. This was a literature-analysis filter, not a service-life certification. Its component rankings describe that dataset and its test conditions. Read the Viewpoint with its published correction.
There is also a specific official benchmark: DOE’s 2024 Multi-Year Program Plan set a 2026 AEM demonstration milestone of 2 A/cm² at 1.8 V with degradation below 4 mV/khr, equivalent to 4 µV/h. It is an R&D milestone with a named date and context, rather than a warranty or proof that a commercial unit meets it. See Table 3.4, printed page 51.
For a project, ask for operation under the intended load profile as well as steady-state data. Starts, stops, standby, pressure changes and recovery procedures can alter what a long test tells you. The European Commission JRC harmonised test protocols provide a useful framework for defining comparable test conditions and system boundaries.
Pure water and KOH are different test conditions
A dissolved alkaline electrolyte can provide ionic pathways within a porous electrode that supplement those supplied by the ionomer. With pure-water feed, catalyst utilization depends much more strongly on the ionomer network and its contact with the catalyst. A strong result in 1 M KOH cannot simply be relabelled as pure-water performance.
Feed history also matters. Ul Hassan and colleagues investigated the change from KOH to deionized water and showed why residual electrolyte and the flushing procedure must be considered when interpreting a nominally pure-water test. Request the conditioning and rinse protocol, along with the feed specification. Their 2022 study addresses this comparison directly.
Progress after the 2016–2024 review window also changes what can be said about pure-water operation. Song and colleagues reported a 5 cm² cell with a cross-linked anode ionomer operating on pure water for 1,813 hours at 1 A/cm² and 80°C, with a reported voltage degradation rate of 0.03 mV/h, or 30 µV/h. The 2025 paper demonstrates a particular electrode design under stated conditions. It also shows why “long duration” and “low degradation rate” must be checked separately.
For equipment selection, electrolyte choice affects liquid handling, compatible materials, water quality control and maintenance. Compare the supplier’s specified feed and service requirements with the utilities and operating staff available at your site.
Components work as an assembly
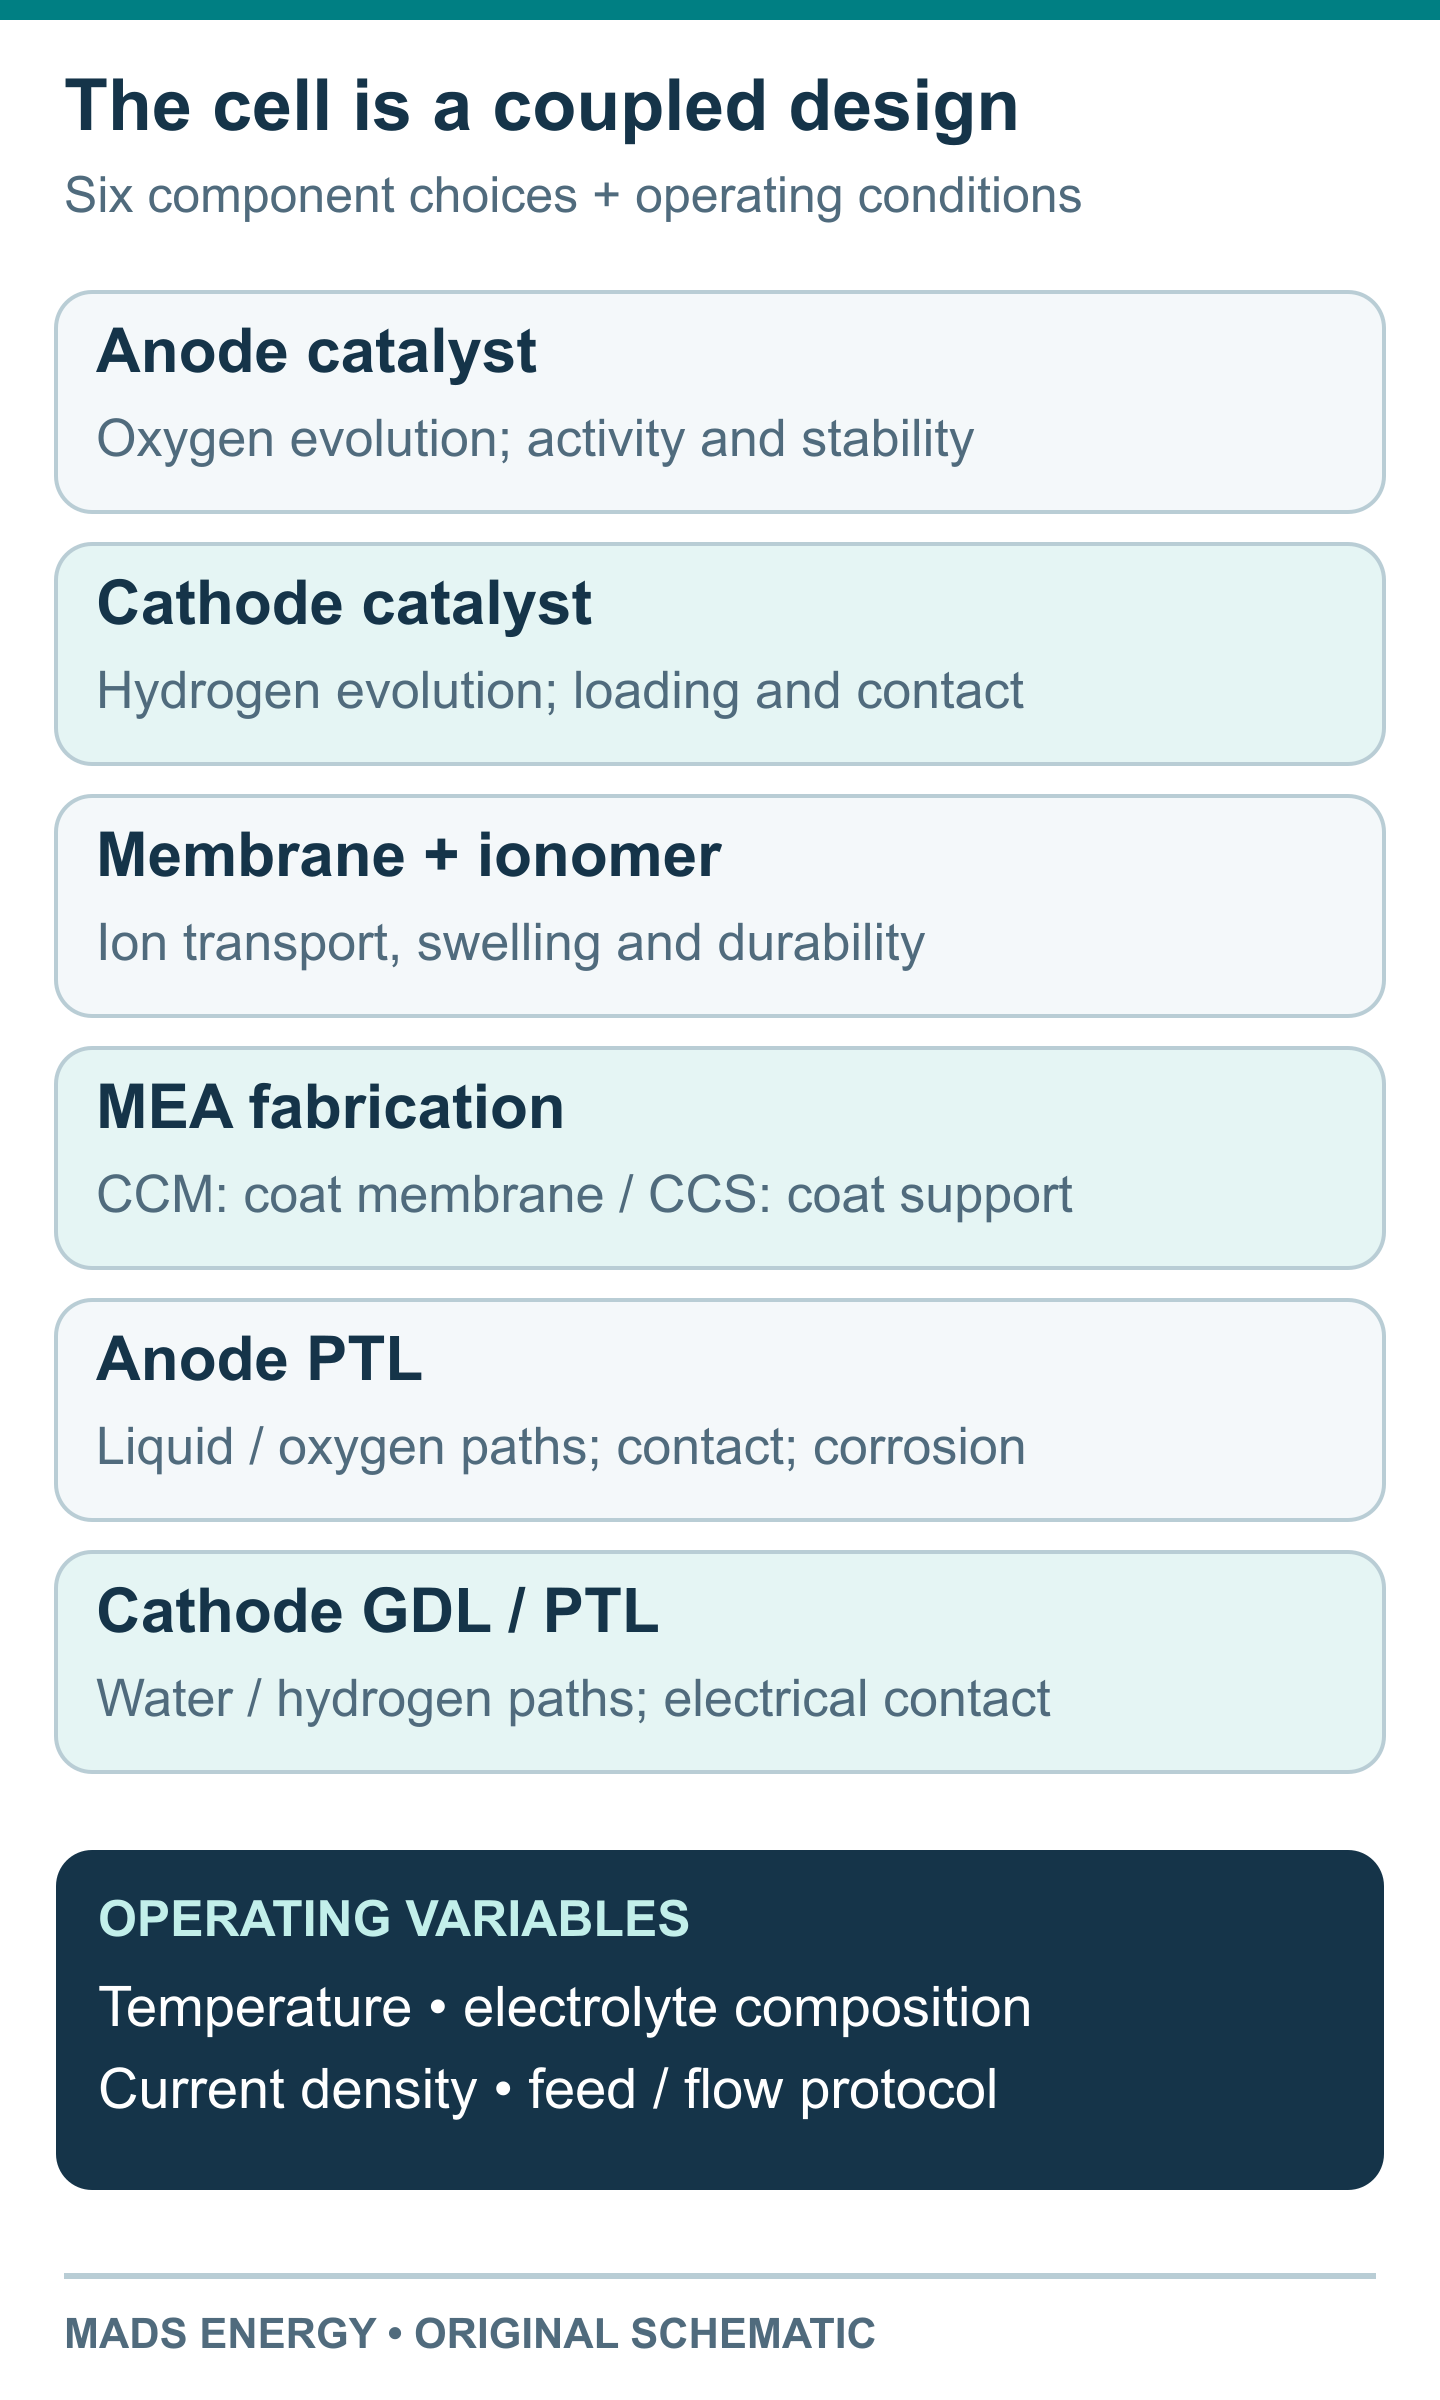
Figure 3. Original component map. Material labels identify design choices, not a universal ranking.
Catalysts and ionomer. Nickel–iron-based anode catalysts can enable oxygen evolution without iridium, while some high-performance AEM demonstrations still use platinum-group metals at the cathode. “AEM” alone therefore does not mean “PGM-free.” Catalyst loading, ionomer content, pore structure and electrical contact determine how much of the catalyst is used. In Song and colleagues’ study, anchoring the catalyst in a cross-linked ionomer network improved electrode integrity and transport; the interface was part of the result, not just the catalyst name.
Membrane and fabrication. Conductivity, thickness, swelling, chemical stability and mechanical support need to be balanced. A catalyst-coated membrane (CCM) places the catalyst layer on the membrane; a catalyst-coated substrate (CCS) places it on a porous support before assembly. Klingenhof and colleagues used a coating approach that controlled membrane swelling during fabrication. Such process details help explain why a CCM or CCS label by itself cannot predict performance or durability.
Imidazolium, piperidinium and other quaternary-ammonium chemistries appear in AEM research. These are broad material families. Compare the specific polymer, reinforcement, thickness and ionomer combination under the proposed conditions, rather than selecting by the family name alone.
Porous transport layers. The anode PTL and cathode transport layer—often called a gas diffusion layer, or GDL—provide electrical contact and paths for liquid and gas. Their pore structure, surface condition and compression affect contact and bubble removal. Material suitability must be checked at the relevant electrode potential and electrolyte conditions; acidic PEM hardware experience does not automatically qualify a component for alkaline AEM service. These roles and corrosion considerations are discussed in the AEM component review.
Temperature and load. Warmer operation can improve reaction and transport rates while changing polymer ageing and water management. Raising current density increases gas production per unit area and changes the demands on transport and cooling. Use the actual operating envelope and test history to assess those choices.
Compare cell, stack and system efficiency separately
A cell voltage is not a complete hydrogen-generator energy figure. A stack combines multiple cells. A complete system adds power conversion and auxiliaries such as circulation, cooling, controls and gas treatment. Drying or compression may be included in one quotation and excluded from another.
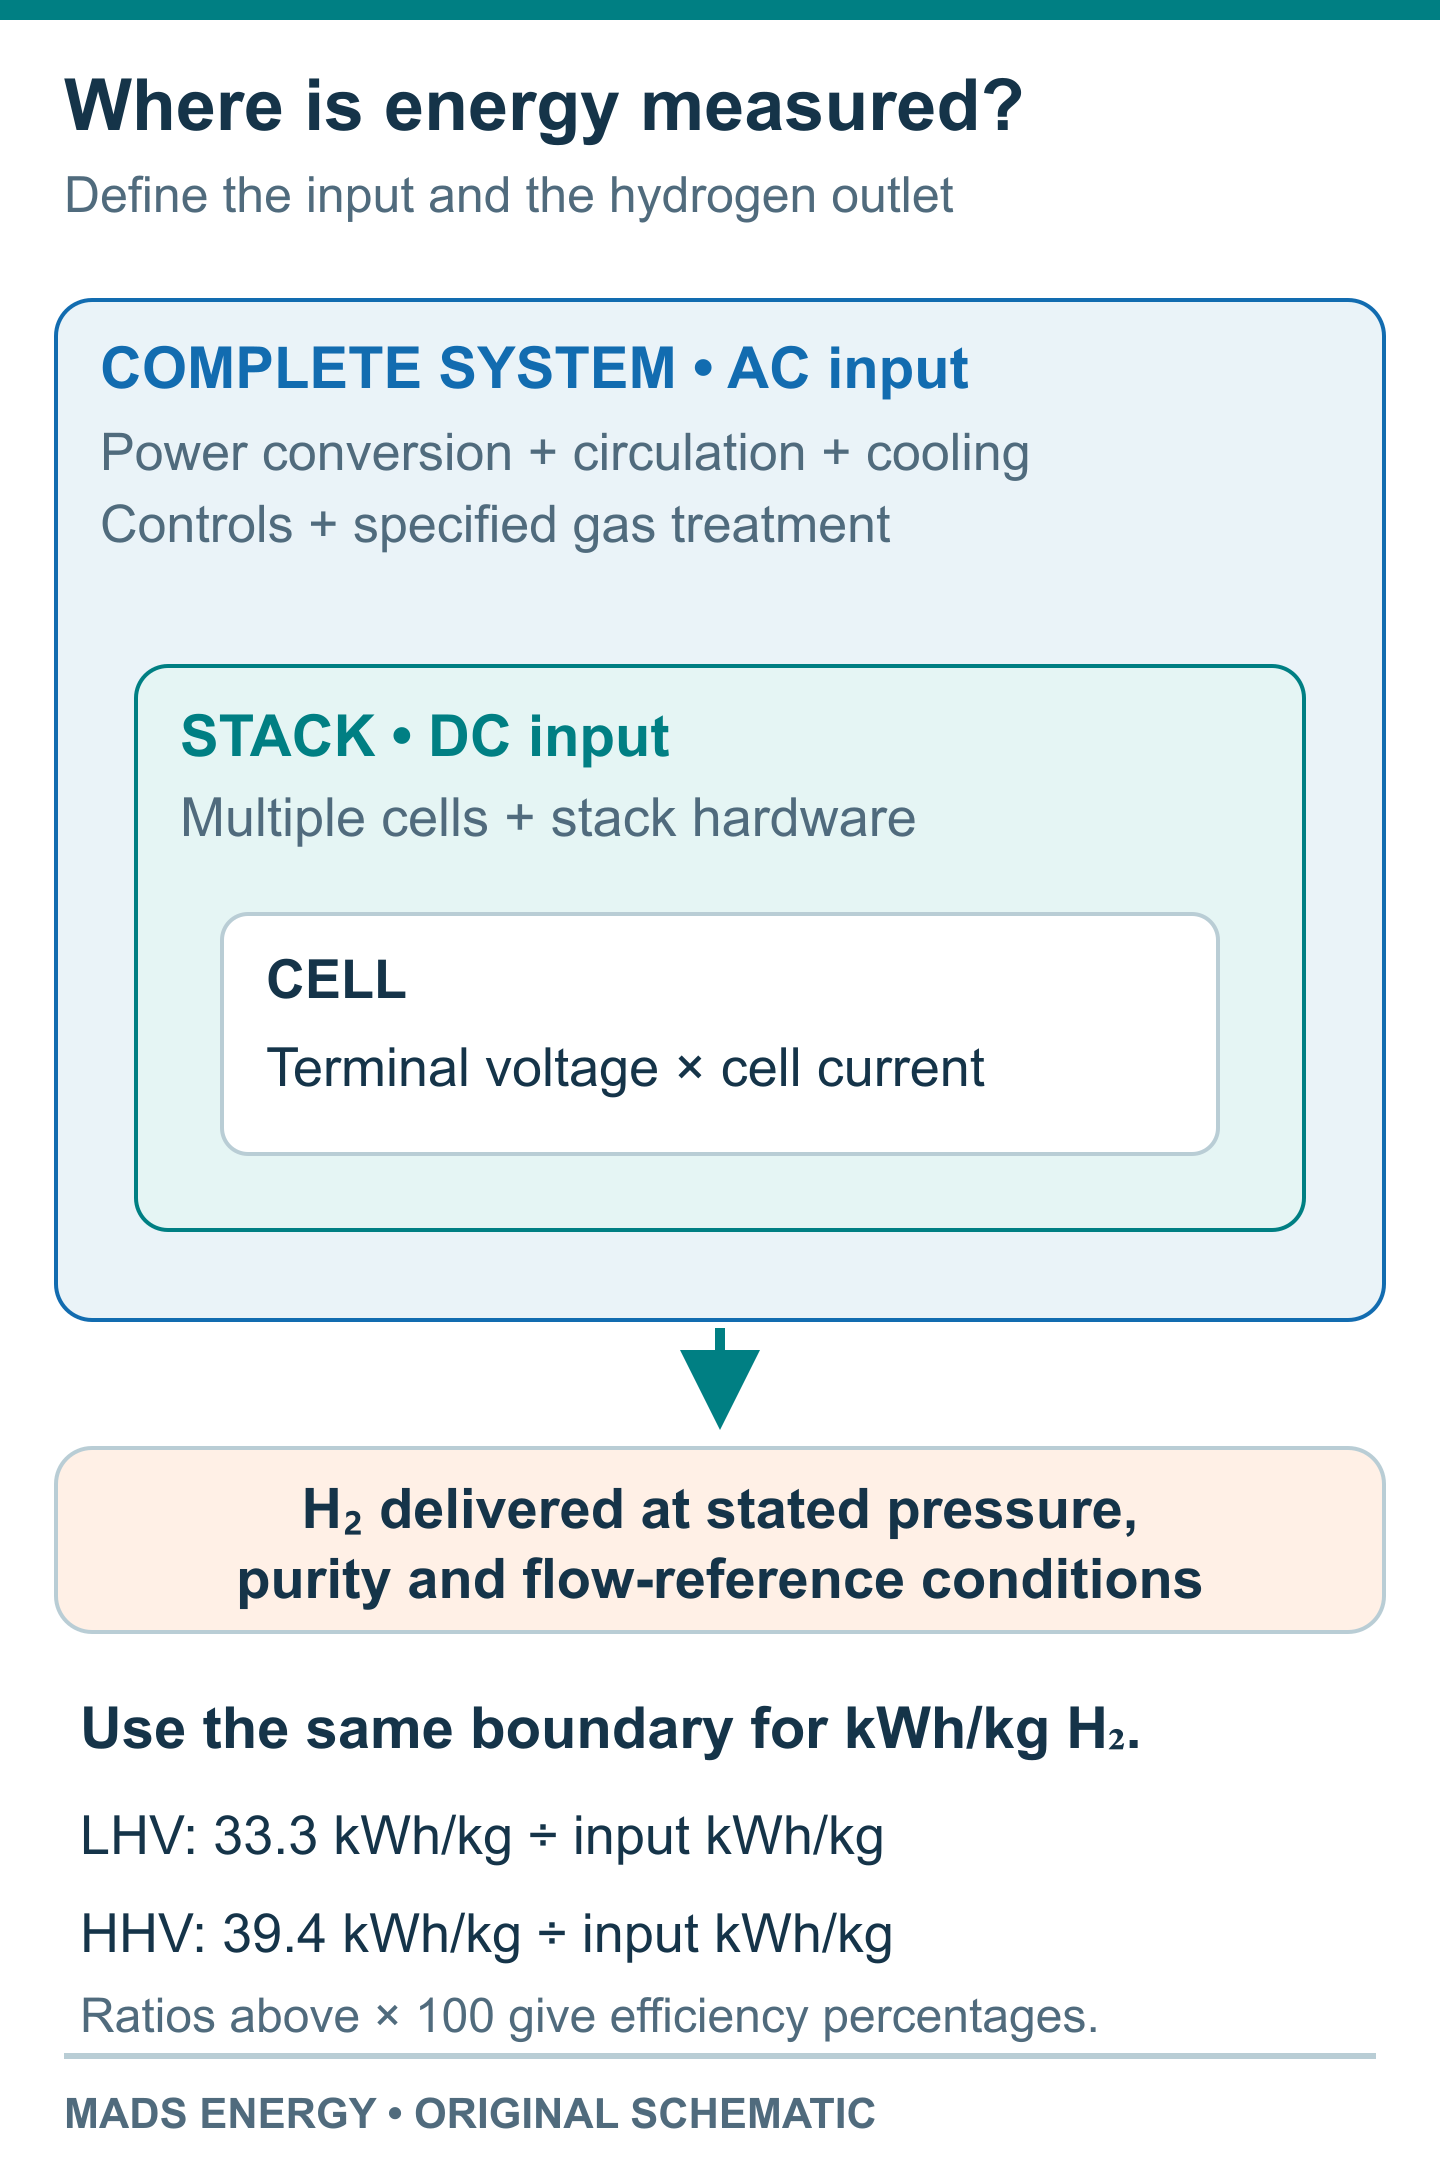
Figure 4. Original measurement-boundary schematic. Compare energy consumption at the same hydrogen outlet conditions and with the same included equipment.
Ask for measured kWh/kg H₂, the AC or DC input boundary, and the delivered hydrogen pressure and purity. If output is stated in normal cubic metres, confirm the reference temperature and pressure used for that volume.
Heating-value convention changes the efficiency percentage too. On a hydrogen mass basis, LHV is approximately 33.3 kWh/kg and HHV approximately 39.4 kWh/kg. For an explicitly illustrative system consuming 50 kWh/kg, the corresponding electrical efficiencies are about 67% LHV and 79% HHV. They describe the same energy consumption. External heat inputs, where relevant, should be reported separately.
DOE’s water-electrolysis technology assessment distinguishes stack and system assumptions. For the commercial delivery boundary, see PEM stack versus complete hydrogen generator.
AEM versus PEM: compare the project evidence
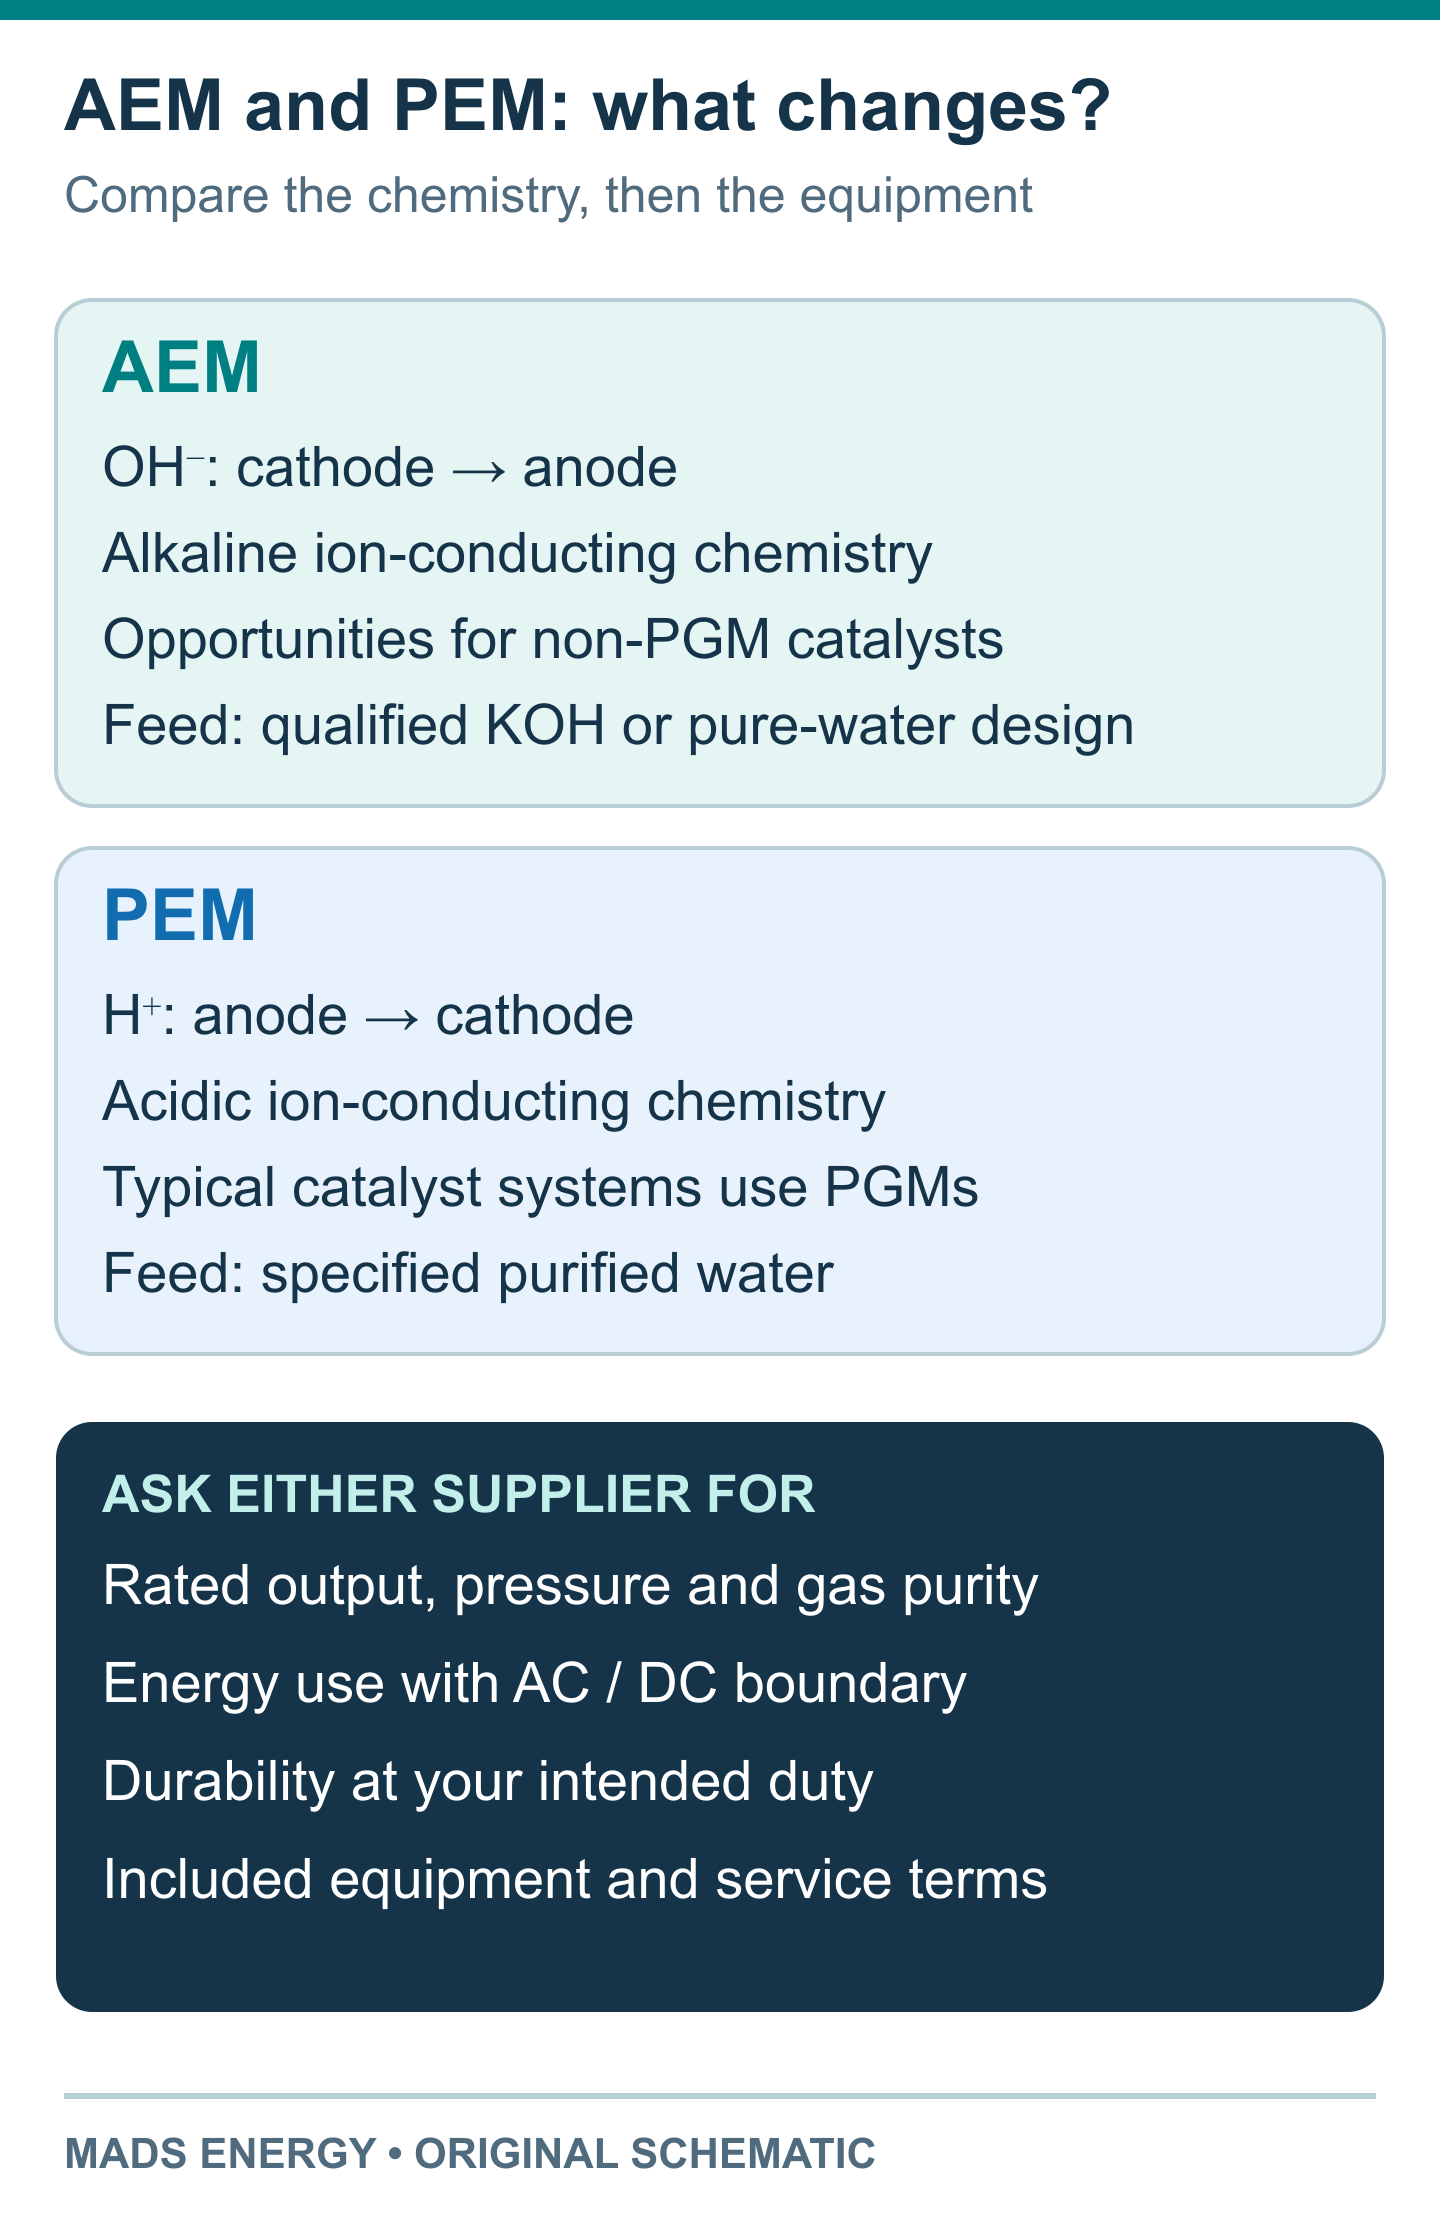
Figure 5. AEM and PEM use different ion-conducting chemistry. The lower panel lists information to request from either supplier; it is not a product rating.
Materials and cost. AEM creates opportunities to reduce reliance on scarce catalyst metals. Actual capital cost also includes manufacturing yield, cell area, stack hardware and the balance of plant. Operating cost includes electricity, maintenance, consumables and replacement. Compare a priced configuration and its service assumptions; membrane chemistry alone cannot establish lower CAPEX or OPEX.
Output and operating duty. Specify required hydrogen flow, outlet pressure, purity, daily operating hours and the expected load profile. Ask for the rated operating point and the evidence that supports it, including gas quality across the usable load range.
Durability and scale. Match the evidence to the offered cell area, cell count and configuration. A small research cell, a short stack and an installed system answer different questions. Record demonstrated operating hours separately from projected life and warranty coverage. An academic peak-performance result and an industrial rating can reflect different design priorities; each needs its own test conditions.
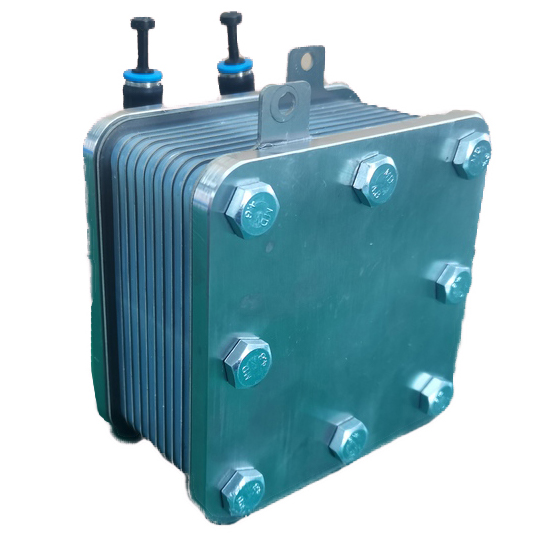
Delivery scope. Establish who provides the power supply, water treatment, cooling, gas handling, control and commissioning. For a PEM project, Mads Energy’s PEM electrolyzer stacks and PEM hydrogen generators are separate starting points for defining that scope. They are PEM product categories; compatibility with AEM chemistry requires a separately qualified design.
The most useful next document is a matched specification: one duty cycle, one output requirement and one energy boundary, with performance and durability evidence attached to the offered configuration.
Sources and further reading
The original topic was prompted by the Chinese summary supplied for this article. The discussion and illustrations here are independently organized around equipment evaluation. The historical comparison is credited to Son, Mirshekari, Raaijman and Corbett’s 2025 ACS Energy Letters Viewpoint and its correction, linked above. The correction changes Figure 1’s current-density unit to A/cm² and corrects a pure-water stability sentence and figure references.
Additional evidence is linked beside the claims it supports: the DOE 2024 program plan and technology assessment, JRC test protocols, Klingenhof and colleagues’ cell measurements, Ul Hassan and colleagues’ electrolyte comparison, Song and colleagues’ pure-water study, and Du and colleagues’ component review. Technical sources checked 26 October 2026. All figures are original explanatory schematics.
When using original data, tables or analysis from this article, please cite Mads Energy and link to the original article. Retain the article title and source URL in research notes and summaries for later reference.
Original article: AEM Water Electrolyzers: Performance, Durability and the PEM Comparison